


Master’s Enrollment Trends at AACSB Schools: A Shifting Landscape
With the new academic year underway, business school leaders worldwide are focusing on admissions and enrollment trends, navigating the lingering effects of the COVID-19 pandemic, and responding to the evolving demands of a diverse student market.
This report aims to provide valuable insights on graduate enrollment trends, drawing on data from AACSB-accredited schools collected in the Business School Questionnaire Programs Module, with the latest findings from 2023–24. This analysis offers a look into some of the common questions around graduate enrollment patterns over the last several years as well as key shifts impacting master’s programs today.
Key Insights
- Enrollment Landscape: In 2023–24, over 660,000 students were enrolled in master’s programs at AACSB-accredited schools. In a controlled comparison, master’s enrollment has grown by 30 percent over the past decade.
- Demand for Master’s Programs: Applications rose 48 percent from 2018–19 to 2023–24, averaging 7 percent growth annually, driven by specialist programs. Acceptance rates remain stable, but fewer admitted students are enrolling. The gap between acceptance rates and admissions yield is closing for schools in the Americas, while the Europe, Middle East, and Africa region has the lowest yield, and Asia Pacific schools show more selective admissions.
- Enrollment Trends: Total master’s enrollment has grown 13 percent over the past six years, with more than half of the schools reporting gains. Specialist programs account for about 50 percent of total enrollment, while MBA programs represent around 30 percent. Regional and program-specific factors shape these trends.
- Shifting Demographics: Master’s specialist programs show gender parity, with many enrolling more women than men, while MBA programs maintain around 40 percent female enrollment. International student enrollment has increased since the pandemic, and white student representation in U.S. master’s programs has declined from 62 to 57 percent since 2018–19.
- Evolving Program Delivery: Business schools are expanding flexible learning options, including digital, hybrid, and part-time formats. While MBA programs are shifting toward online and hybrid delivery, 70 percent of specialist program students still prefer in-person learning. Full-time enrollment remains dominant, accounting for 66 to 67 percent of total enrollment across all programs.
- Navigating a Changing Environment: Graduate enrollment is becoming more dynamic and interconnected with global trends. Business schools are responding to challenges by expanding into new markets, developing specialized programs, and emphasizing lifelong learning. AACSB supports schools’ efforts to align their programs with the evolving needs of students, employers, and society.
A Look at the Enrollment Landscape
To better understand business school graduate enrollment trends, much of this report will focus on a controlled group of schools that have consistently reported data to AACSB over the indicated years. While this approach offers a smaller sample of schools, it provides more reliable insights.
Before diving into the detailed analysis, we present the following snapshot of AACSB’s most recent global enrollment data for accredited schools. This includes a breakdown of the different master’s program offerings, which are explored in greater depth throughout the report.
2023-24 Snapshot of Enrollment Counts by Program

Tracking a Decade of Enrollment Shifts Across Programs
10-Year Enrollment Trend by Program
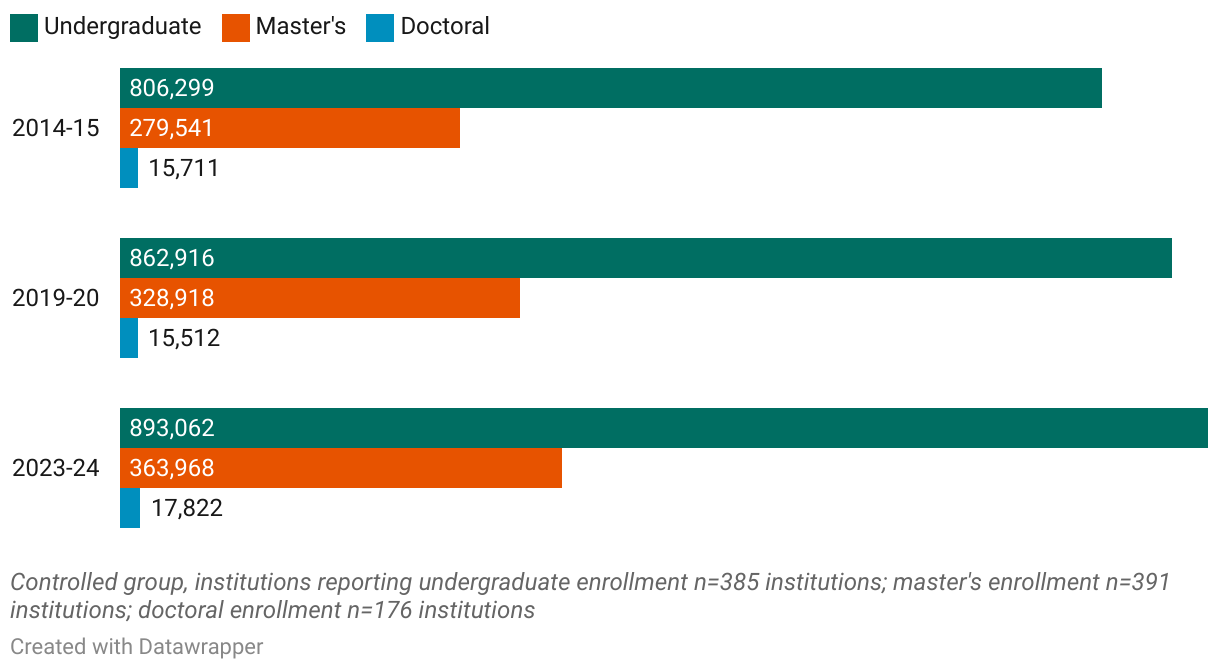
We also examined undergraduate and doctoral enrollment data to compare changes in master’s level enrollment with broader business school trends. Over the past decade, undergraduate enrollment has grown by 11 percent globally. However, this growth wasn’t universal; schools in Oceania were an exception, reporting a 12 percent decline in undergraduate enrollment during the same period.
Enrollment at the master’s level has surged by an impressive 30 percent. This growth was widespread across all subregions, with Asia and Africa boasting the highest growth rates, at 66 percent and 53 percent, respectively.
Meanwhile, doctoral enrollment rose by 13 percent over the same 10-year period. Asia and the Middle East saw the most dramatic gains at this level, with nearly 80 percent growth. In contrast, Europe and the Near East experienced an 11 percent decline in doctoral enrollment, highlighting regional differences in doctoral program participation.
| Explore Data |
Demand for Master’s Programs
Since the pandemic, demand for business graduate education has undergone significant fluctuations. Lockdowns, mass layoffs, hiring surges for remote work, widespread resignations, and the need for new skills have all impacted the business world—and, by extension, graduate business education.
While the data reflect, to an extent, how these market forces have influenced admissions and enrollment figures, the overall changes may not appear as dramatic as some media reports have suggested. Although some figures may understate the challenges and shifts happening on the ground at many business schools, overall, demand for graduate business education at AACSB-accredited institutions remains strong.
Rising Applications and Offers, but Slower Growth in New Entrants
6-Year Trends of Master’s Program Admissions
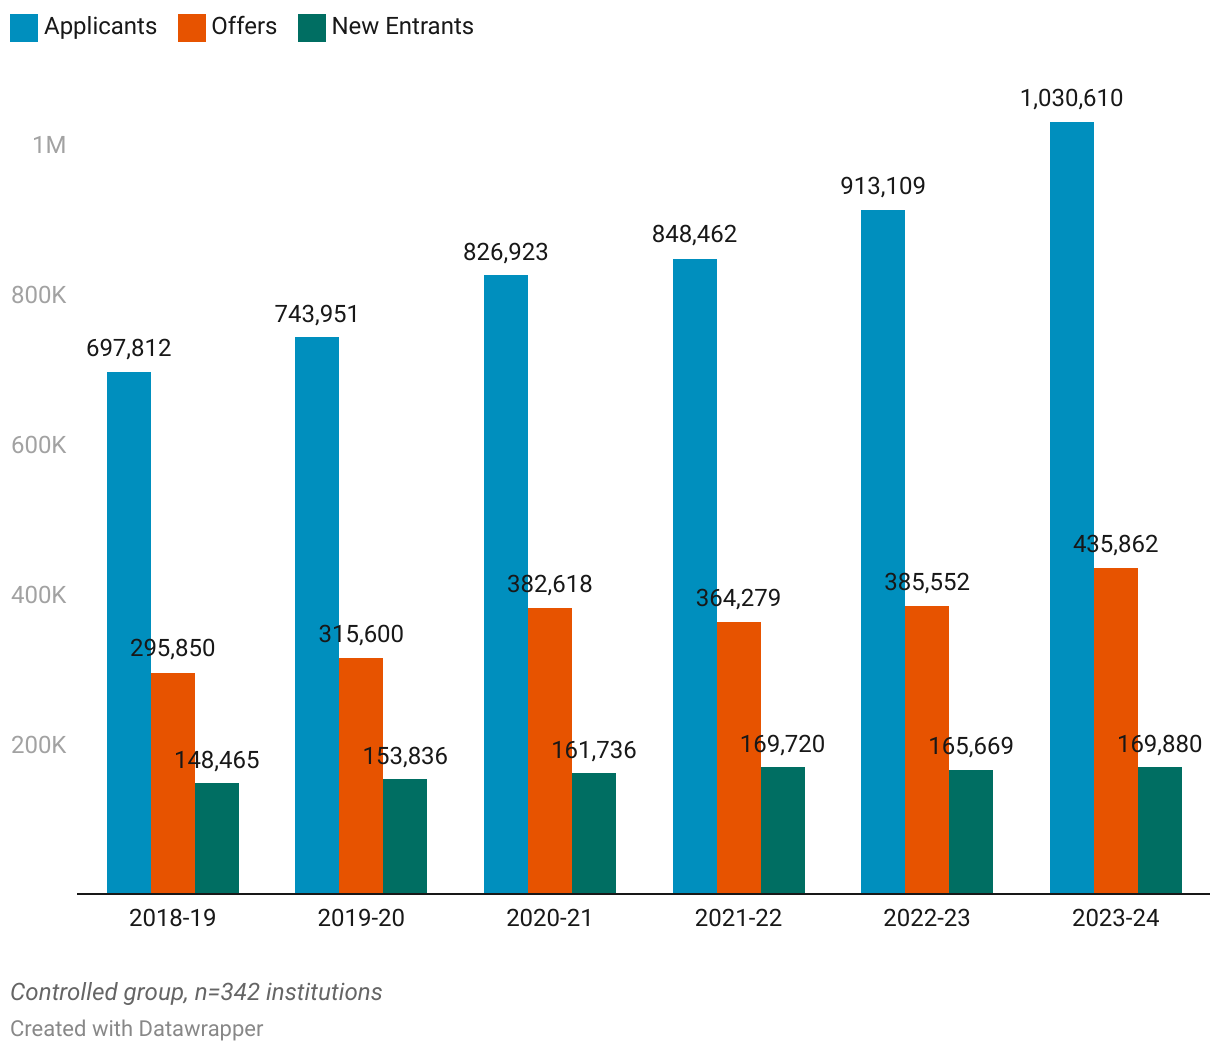
Over the past six years, master’s programs have experienced a steady rise in applicants, with an average annual growth rate of 7 percent, leading to an impressive total increase of 48 percent in applications.
At the same time, offers extended by institutions have kept pace with this demand. Despite a dip in 2021–22, offers to prospective students have grown on average by 7 percent annually, resulting in a 47 percent total increase.
However, the number of new entrants to master’s programs has seen more modest growth, with a total increase of 14 percent and an average annual growth rate of just 2 percent, despite a slight drop in 2022–23. This slower conversion of applicants to enrolled students suggests that external factors may be influencing enrollment decisions, prompting business schools to reconsider their strategies for encouraging students to commit to enrolling.
Regional Observations
Percentage of Master’s Applicants by Region

Nearly half of the total master’s-level applications are to schools in Europe, the Middle East, and Africa (EMEA), despite the region having fewer represented schools in this sample compared to the Americas. This suggests that certain schools in EMEA are attracting a particularly high volume of interested candidates.
Program Type Observations
Percentage of Applications per Program

Master’s specialist programs have been the key force behind the overall growth in applications for master’s business offerings. Over the past six years, these programs have been the only category to show consistent growth, standing out as a significant driver in the market.
Master’s specialist programs have been the key force behind the overall growth in applications for master’s business offerings.
When we compare application trends across master’s specialist, MBA, and master’s generalist programs, which often attract similar candidates, it’s clear that master’s specialist programs are in the highest demand. This program type has accounted, on average, for around 60 percent of all applications over the last six years, peaking at 64 percent in the 2023–24 cycle. In contrast, MBA programs have seen a steady decline in their share of applications, falling from 30 percent in 2018–19 to just 24 percent in 2023–24.
Stability in Acceptance Rates, Declining Admissions Yields
The following charts provide key insights into admissions trends at the master’s level, focusing on two important metrics: acceptance rates and admissions yields. These metrics play a crucial role in understanding institutional competitiveness and student decision-making.
|
6-Year Trend of Acceptance Rates by Program
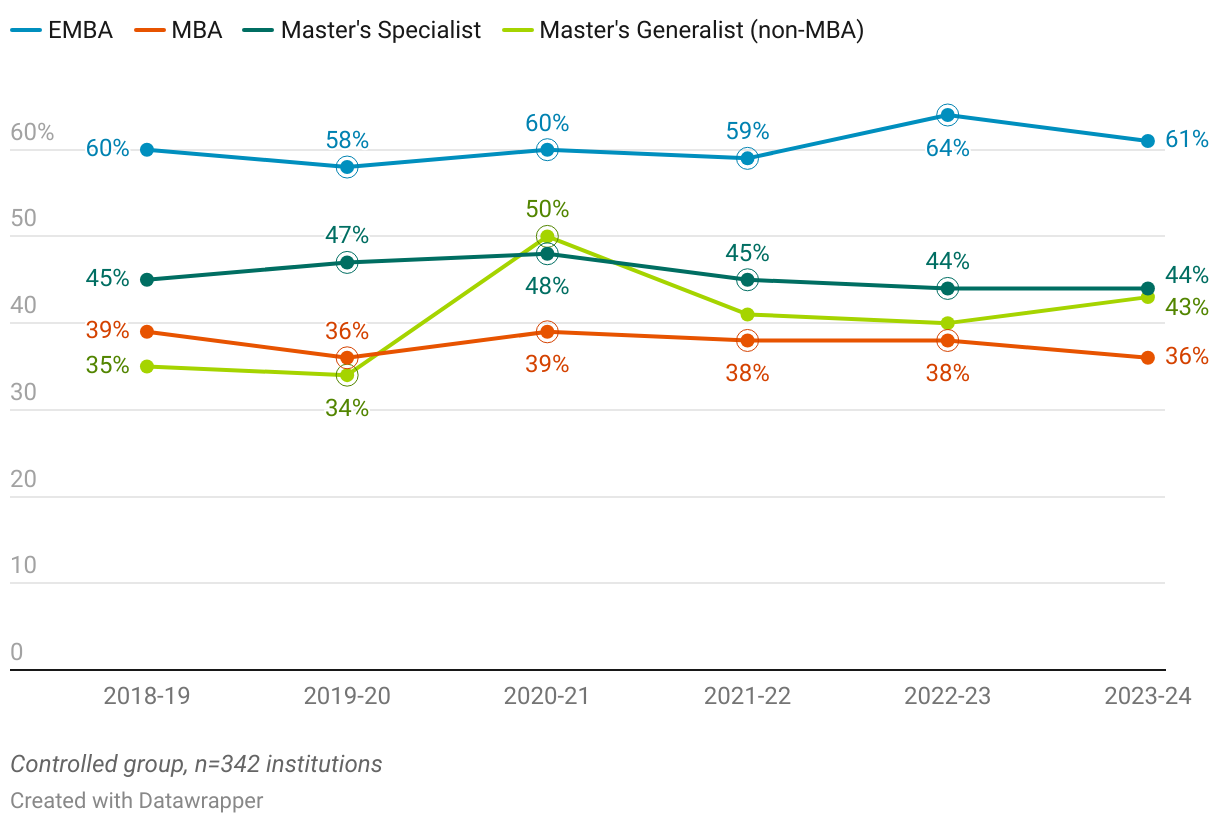
Over the past six years, acceptance rates for master’s programs have remained relatively stable, with only modest growth. Notably, there was a spike in acceptance rates for master’s generalist programs during the 2020–21 period.
Executive MBA programs consistently have higher acceptance rates—around 60 percent—compared to MBA programs, at 36–39 percent, and master’s specialist programs, at 44–48 percent.
This difference can be attributed to the targeted nature of EMBA programs, which typically attract experienced professionals with established careers. These applicants tend to be more self-selective and highly qualified, resulting in higher acceptance rates. In contrast, MBA programs appeal to a broader and more competitive applicant pool, which naturally leads to lower acceptance rates.
Executive MBA programs consistently have higher acceptance rates compared to MBA programs and master’s specialist programs.
6-Year Trend of Admissions Yields by Program
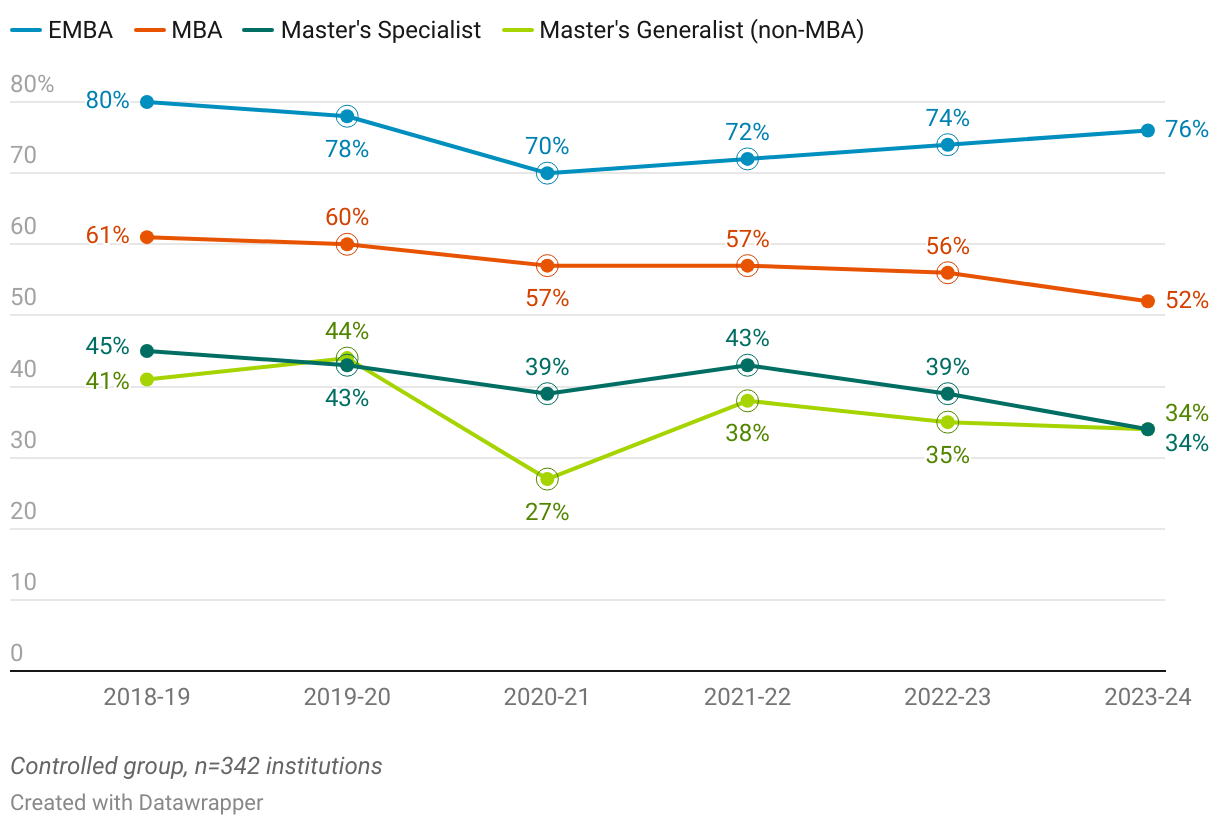
Alternatively, admissions yield for master’s programs has steadily declined, with fewer admitted students ultimately choosing to enroll. This trend is consistent across all types of master’s programs. Among them, master’s specialist programs have seen the steepest drop in admissions yield, falling from 45 percent in 2018–19 to 34 percent in 2023–24. This decline may indicate that students are applying to multiple programs, giving them more options in their final enrollment decisions.
Additionally, the specialized nature of master’s specialist programs likely encourages students to compare different schools offering similar focus areas. As a result, they may delay their decisions or base their final choices on factors such as location, institutional reputation, or career placement opportunities.
Regional Variations in Admissions
6-Year Trend of Acceptance Rate vs. Admissions Yield by Region
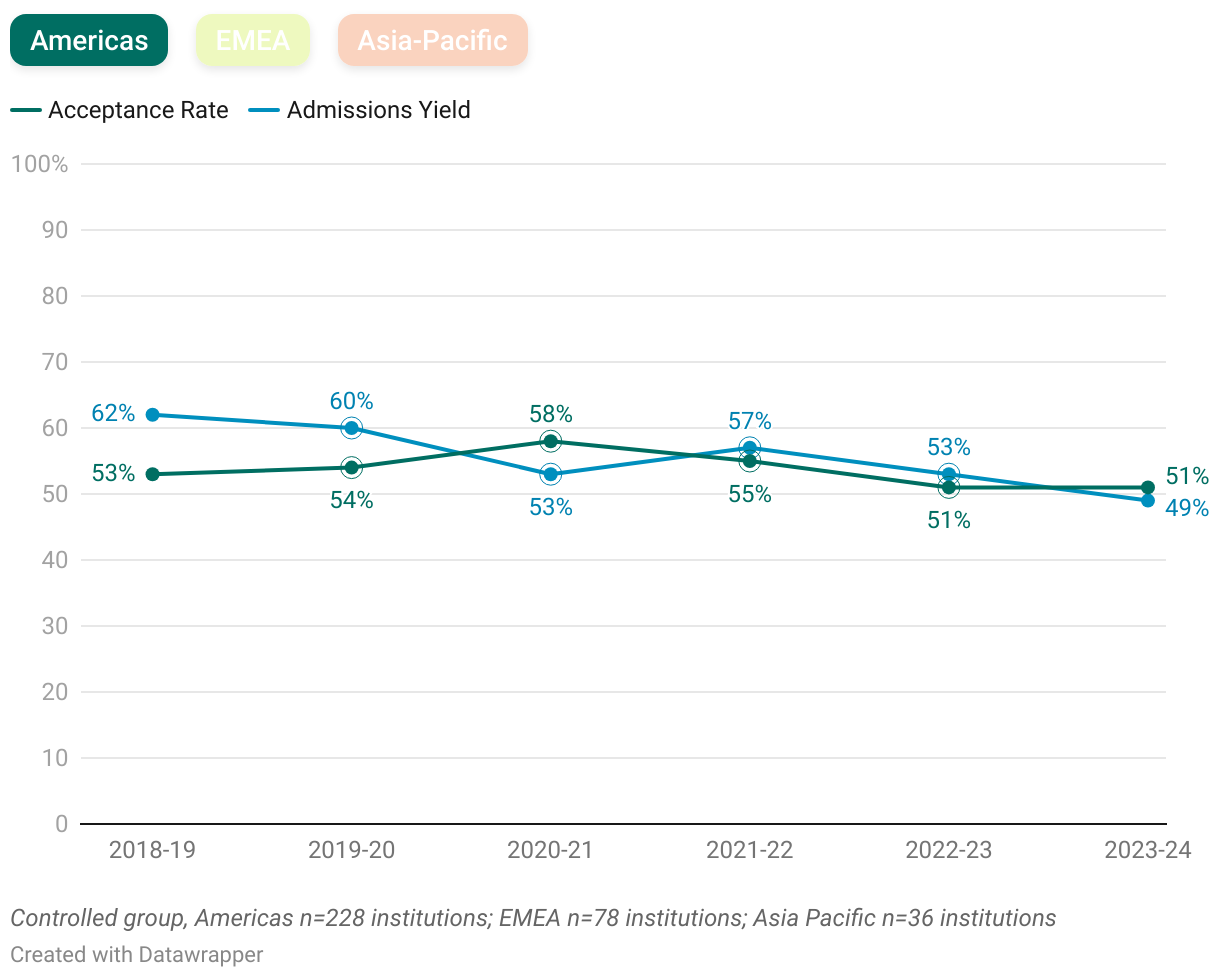
The data reveal significant regional differences in acceptance rates and admissions yields. In the Americas, schools tend to admit a larger pool of applicants, and a higher percentage of those admitted ultimately choose to enroll.
In contrast, schools in the EMEA region have the lowest admissions yield, meaning that a smaller proportion of admitted students decide to enroll.
Meanwhile, in the Asia Pacific region, the trend is almost the opposite of EMEA. Schools are more selective in their admissions, yet a larger proportion of admitted students go on to enroll, reflecting a stronger conversion from offers to enrollment.
Enrollment Trends for Master’s Programs
Enrollment trends at graduate business programs over the past six years reveal a complex and rapidly changing global landscape, making broad generalizations difficult. While some regions have experienced notable declines, for example, due to declining birthrates, others have shown resilience, for instance, from targeted government policies or favorable economic conditions.
Our analysis indicates that, overall, master’s enrollment at AACSB-accredited schools has remained steady. However, the diversity of these schools is evident: even within the same region, enrollment trends vary. Some schools experience year-to-year fluctuations, reflecting both the accelerated pace of change in the business world and the evolving demands of business education. In each environment, trends can shift quickly and may not last beyond a single year.
6-Year Trend of Master’s Enrollment by Program
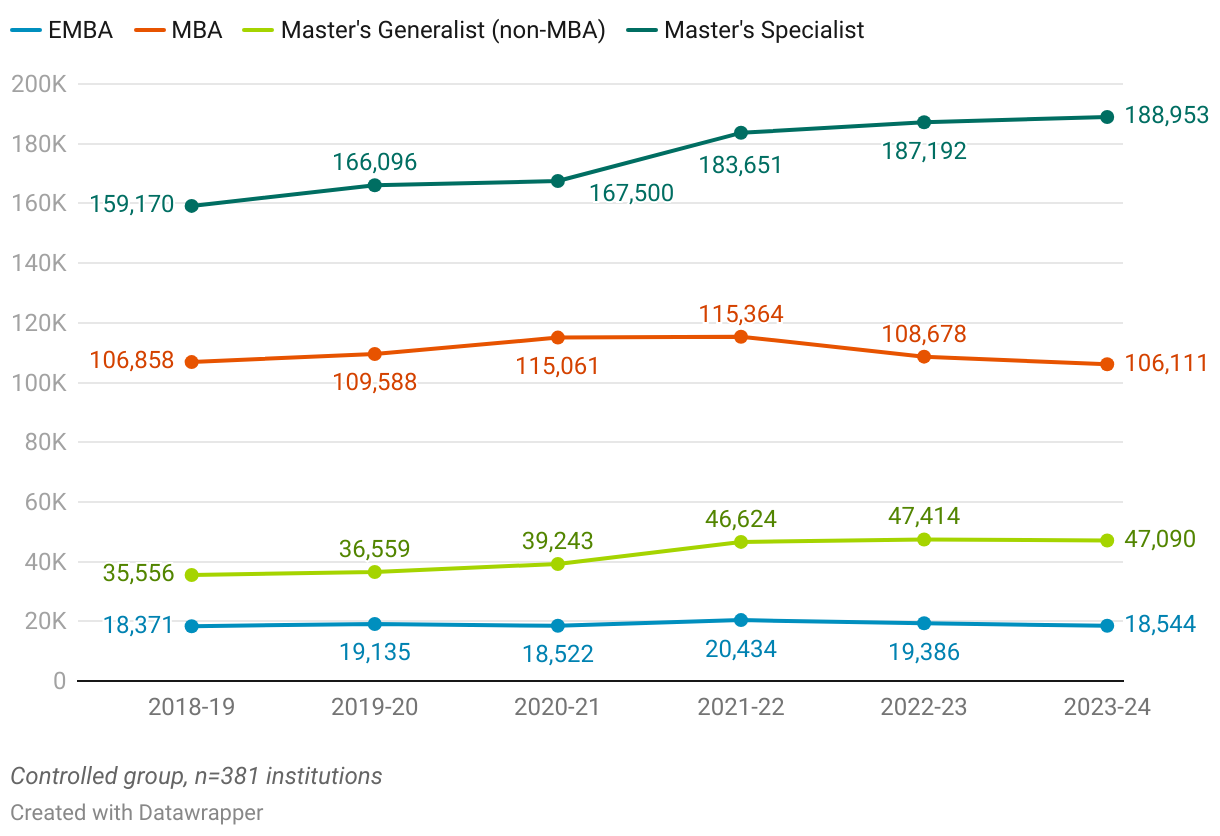
Overall, total master’s enrollment has grown by 13 percent over the past six years, with higher numbers in 2023–24 compared to 2018–19. However, despite this growth, enrollment has shown a slight decline since peaking in 2021–22 at just over 366,000, with a 1.4 percent drop. Moving forward, it will be important to monitor whether this downward trend continues.
At the program level, there are some key trends to note:
- Executive MBA programs have seen relatively stable enrollment, with a notable surge in 2021–22. This spike may be due to post-pandemic factors or the "Great Resignation," as executives sought opportunities for upskilling. Since that period, enrollment has leveled off, returning to pre-pandemic levels.
- MBA programs experienced modest growth starting in 2018–19 and peaking in 2021–22. However, by 2023–24, enrollment had returned to pre-pandemic levels, resulting in a slight overall decline of 1 percent over the six-year period.
- Specialized master’s enrollment has grown by 19 percent over the past six years, with steady annual increases of around 3 percent, highlighting the strong and sustained demand for these programs.
Minimal Change in Enrollment Distribution Across Programs
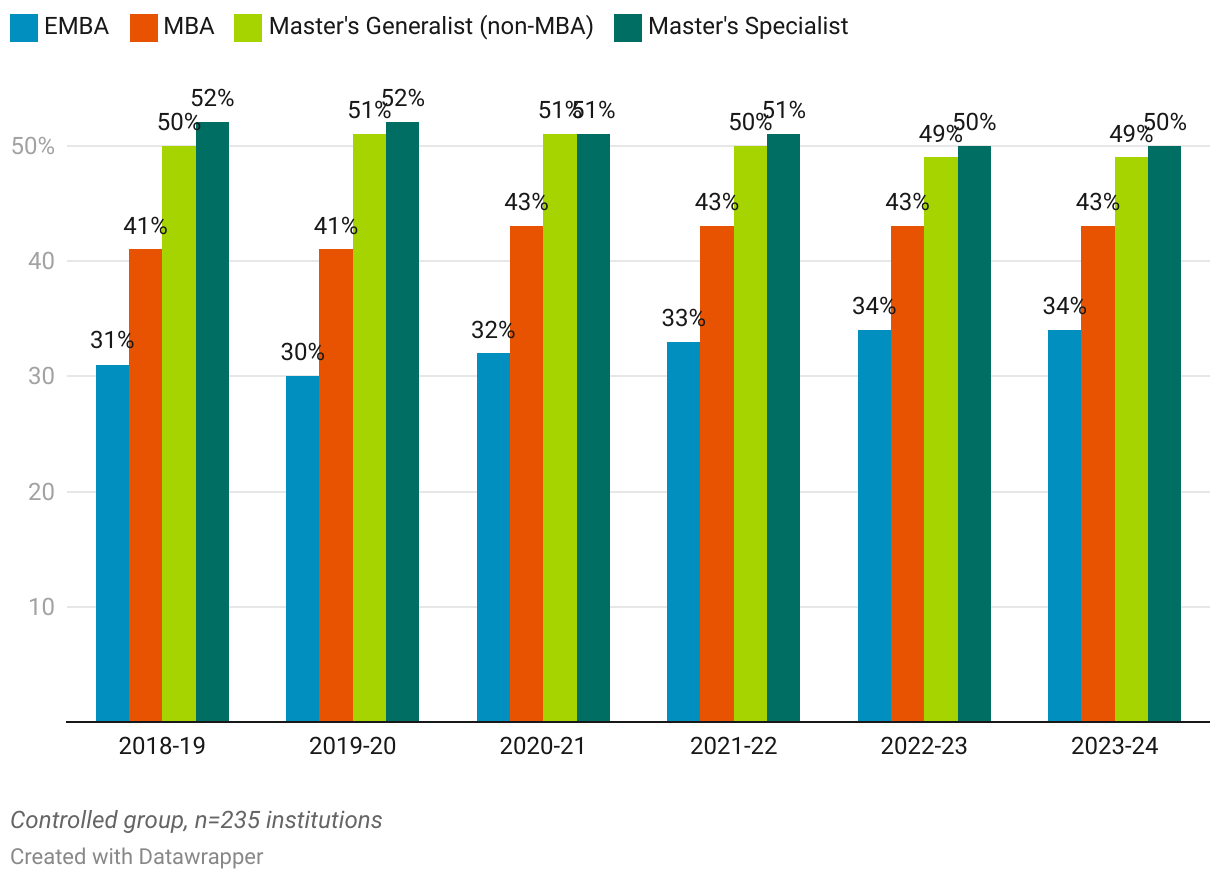
Despite some notable changes in enrollment over the past six years, the overall distribution of enrollment across the master’s level has remained relatively stable. Master’s specialist programs have consistently accounted for around 50 percent of total master’s enrollment, with a slight increase from 50 to 52 percent during this six-year period. Similarly, MBA enrollment has followed a steady pattern, representing approximately 30 percent of total master’s level enrollment, with a modest decline from 33 to 29 percent by 2023–24.
Master’s specialist programs have consistently accounted for around 50 percent of total master’s enrollment, with a slight increase from 50 to 52 percent during this six-year period.
6-Year Trend of Master’s Enrollment by Region

Regional trends in graduate enrollment show some distinct patterns over the past six years:
- Annual growth rate: Schools in EMEA and the Americas experienced steady annual growth rates of 2 percent, while those in the Asia Pacific region saw a slightly higher rate of 3 percent each year.
- Six-year growth: Over the six-year period, graduate enrollment increased by 12 percent in both the Americas and EMEA, while it soared to 18 percent growth in the Asia Pacific region.
- EMEA prominence: While EMEA consistently has the highest graduate enrollments within this group of schools, it’s important to recognize the different school counts across regions and the impact of a few “power player” institutions that attract a large share of students.
- Program changes: During this six-year period, many schools expanded or adjusted their program offerings. EMEA schools increased their number of programs by 16 percent (from 938 in 2018–19 to 1,089 in 2023–24); schools in the Americas saw a 13 percent increase (from 1,066 to 1,205); and Asia Pacific schools experienced the most growth, expanding by 22 percent (from 313 to 381 programs).
Tracking the Range of Enrollment Shifts: From Decline to Growth
While the data presented in this report are aggregated, it’s important to recognize the variability in enrollment trends among the schools within this controlled set. Some institutions have experienced significant increases or decreases in enrollment due to factors like added or discontinued programs, or their enrollment numbers may simply be a reflection of their size compared to other schools in the set.
The following charts illustrate the range of enrollment changes across these schools, providing greater clarity on the types of shifts occurring within AACSB-accredited institutions.
6-Year Range of Enrollment Changes in Total Master’s Enrollment Across Schools
Over the past six years, more than half of AACSB-accredited schools worldwide (54 percent) have reported growth in their master’s level enrollment, while 32 percent have experienced declines during the same period.
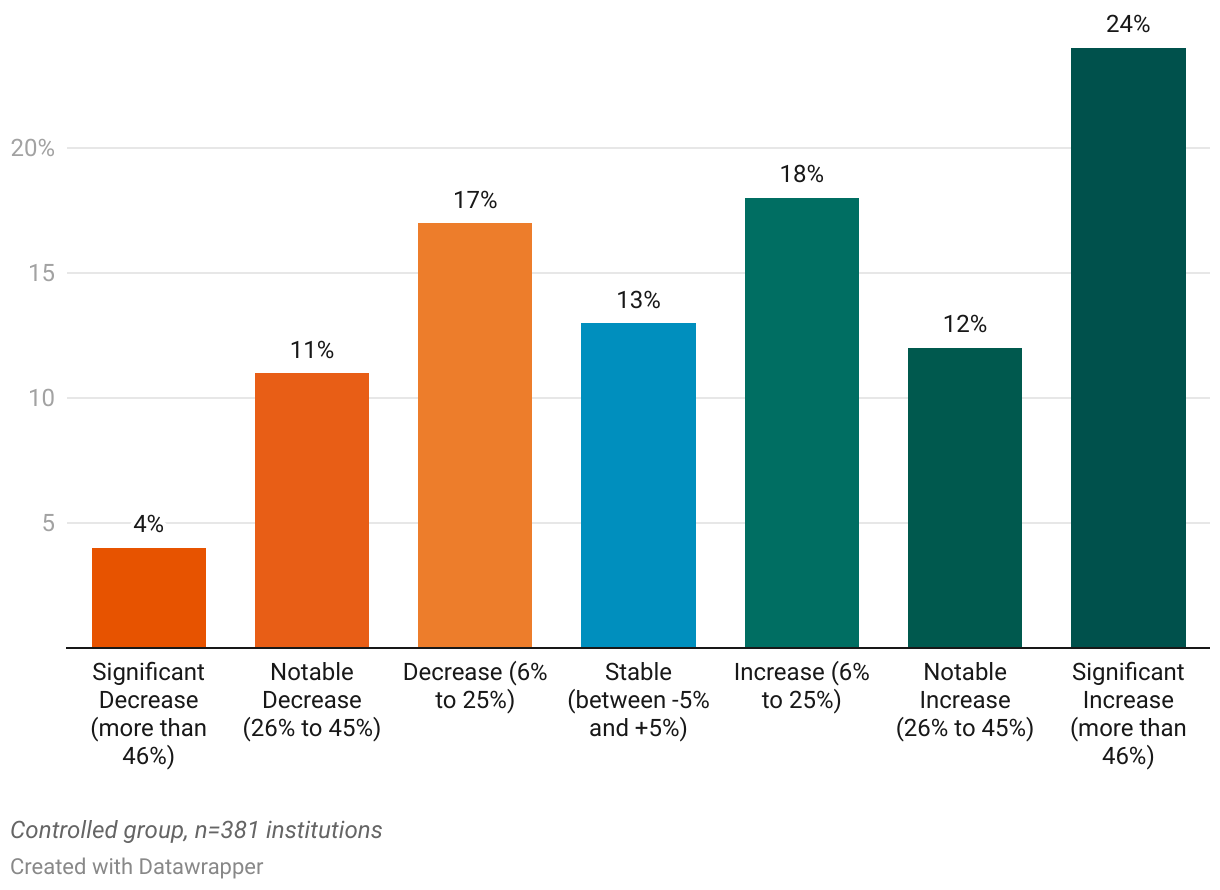
6-Year Enrollment Change Across Schools: MBA
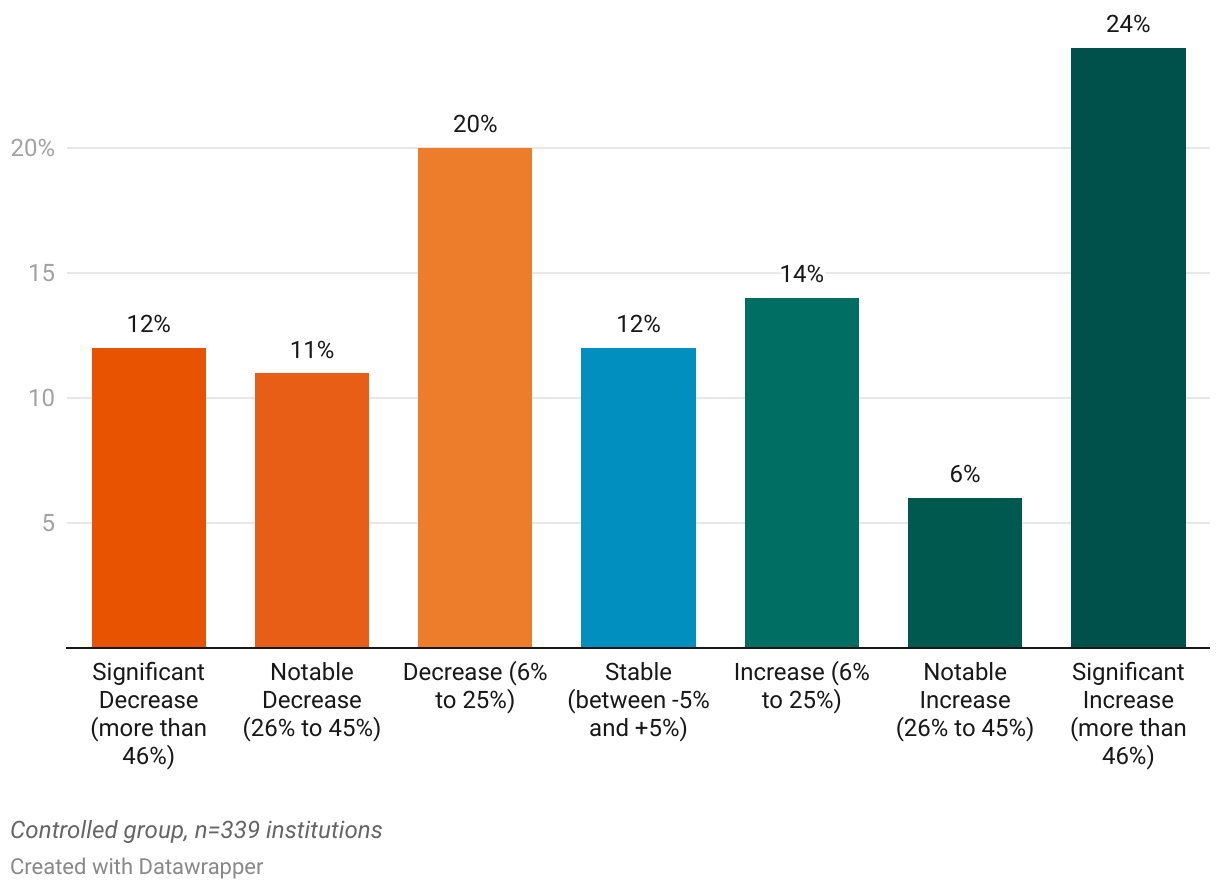
6-Year Enrollment Change Across Schools: Master’s Specialist

Specialized master’s programs have shown the strongest growth, with 61 percent of schools reporting increased enrollments. In contrast, MBA programs present a more balanced picture, with schools reporting growth and declines in nearly equal proportions.
Schools that reported a significant enrollment surge of 46 percent or more have a wide variety of backgrounds. This growth is often attributed to the introduction of new programs, the natural evolution of existing offerings, and various other factors not captured in the data, such as efforts to attract a broader and more diverse student population.
Shifting Demographics
Over the past few decades, many business schools worldwide have made concerted efforts to attract more females into their graduate programs. AACSB trend data suggest that those efforts are slowly paying off.
Insights Into Gender Balance
Female representation in business graduate education varies by program. While some have reached near gender parity, others remain male-dominated, showing that certain programs are better at attracting female students. Although female enrollment still lags in many areas, slow but steady progress is taking shape, with small increases in female representation indicating gradual efforts to close the gender gap.
6-Year Trend of Female Representation in Master’s Enrollment
Program Type Observations
- Executive MBA programs consistently show the widest gender disparity across all program types. In 2018–19, women made up only 31 percent of total EMBA enrollment, but by 2023–24, this number had grown slightly to 34 percent. However, this gender gap persists across all regions, indicating that EMBA programs globally face challenges with gender inclusivity.
While the total number of women enrolled in these programs has increased, overall enrollment in the Americas has declined, suggesting that broader factors, such as declining demand for executive programs, may be at play.
EMBAs inherently target senior business executives and managers, as these programs are designed to meet the needs of leaders at that level. Consequently, the gender imbalance in EMBA enrollment may reflect the broader gender imbalance among executives in companies. Additionally, the ongoing gender gap in EMBA programs hints at possible barriers for women in executive education, which could include work-life balance, institutional biases, or limited outreach efforts. - MBA programs are closer to achieving gender balance but remain male-dominated. Female enrollment has held steady at around 40 percent over the past six years, a trend that is consistent across all regions. This persistent gender imbalance highlights the need for more targeted efforts to boost female participation, such as mentorship programs, scholarships, and leadership development opportunities.
- Master’s specialist and master’s generalist (non-MBA) programs are approaching gender parity, with female enrollment nearing 50 percent in many regions. In some cases, particularly in the Asia Pacific region, women have slightly outnumbered men, demonstrating a more balanced gender representation.
These programs may be more attractive to women due to features like shorter time frames, less reliance on prior work experience, in-demand skill development, and the direct career pathways they tend to offer.
Master’s specialist and master’s generalist (non-MBA) programs are approaching gender parity, with female enrollment nearing 50 percent in many regions.
Distribution of Gender Parity: MBA vs. Specialized Master’s
Another way to examine gender representation in master’s enrollment is by looking at the distribution of gender representation across different program types. For this analysis, gender parity is defined as programs where 45 to 54 percent of enrollment is female. Notable differences emerge when comparing MBA programs and specialized master’s programs.
6-Year Trend in Gender Distribution: MBA vs. Specialized Master’s
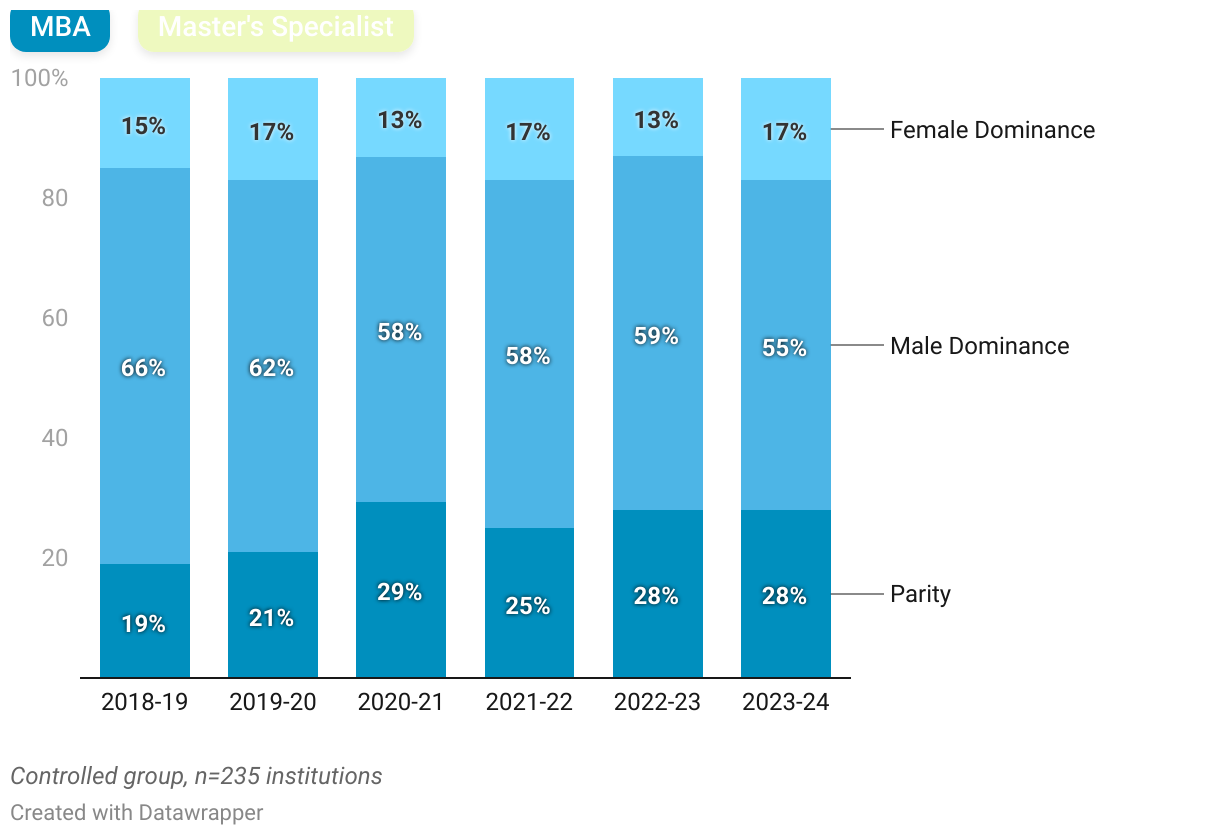
Globally, specialized master’s programs have consistently had a higher proportion of female-dominant enrollment, with nearly 40 percent of programs fitting this category over the past six years. In contrast, a significantly smaller percentage of MBA programs have female-dominated enrollment, ranging between 13 and 17 percent over the same period.
The proportion of MBA programs achieving gender parity has increased from 19 percent in 2018–19 to 28 percent in 2023–24.
However, when it comes to gender parity, MBA programs are seeing more growth. The proportion of MBA programs achieving gender parity has increased from 19 percent in 2018–19 to 28 percent in 2023–24, while master’s specialist programs have remained relatively steady, with around 20 percent of programs reaching gender parity over the last six years.
International Student Presence
Many business schools prioritize fostering an international presence in their classrooms to expose MBA and master’s students to global and diverse perspectives. However, the representation of international students can vary widely by school or region, influenced by recruitment strategies and external sociopolitical factors beyond their control.
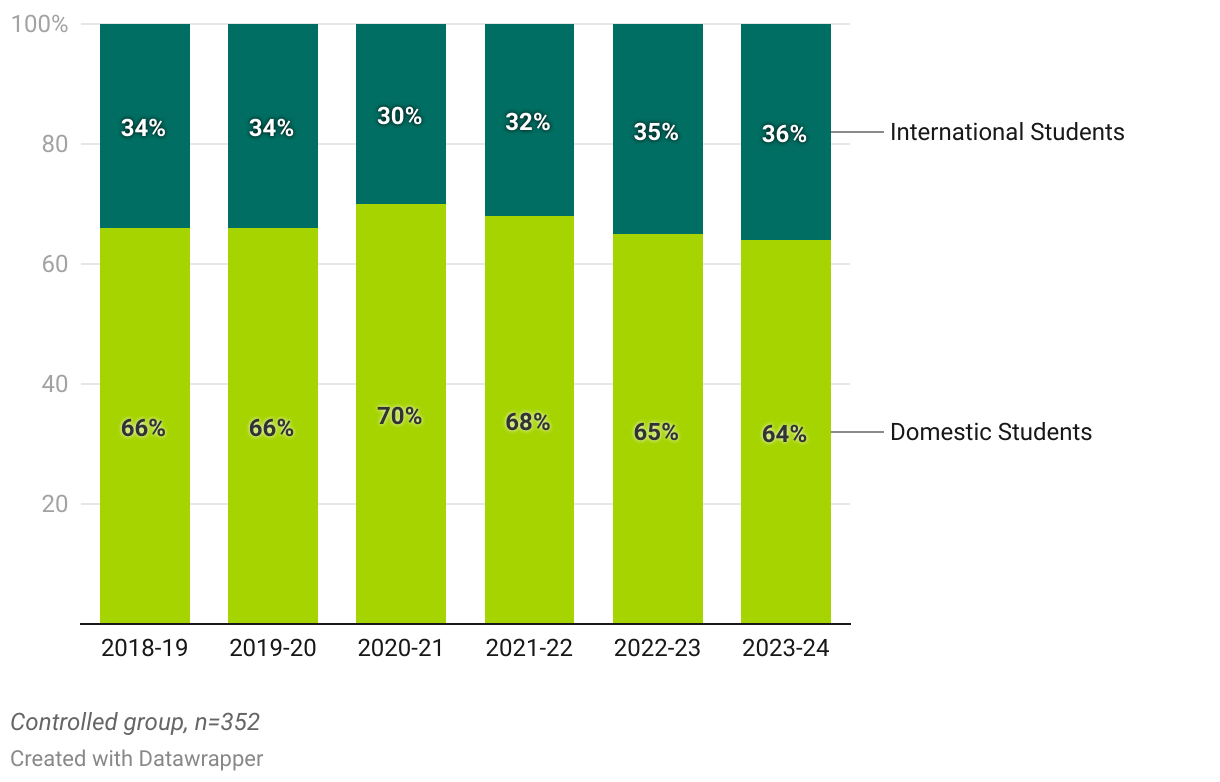
6-Year Trend in Domestic vs. International Student Distribution in Master’s Program Enrollment
6-Year Trend in Distribution of International Students by Region
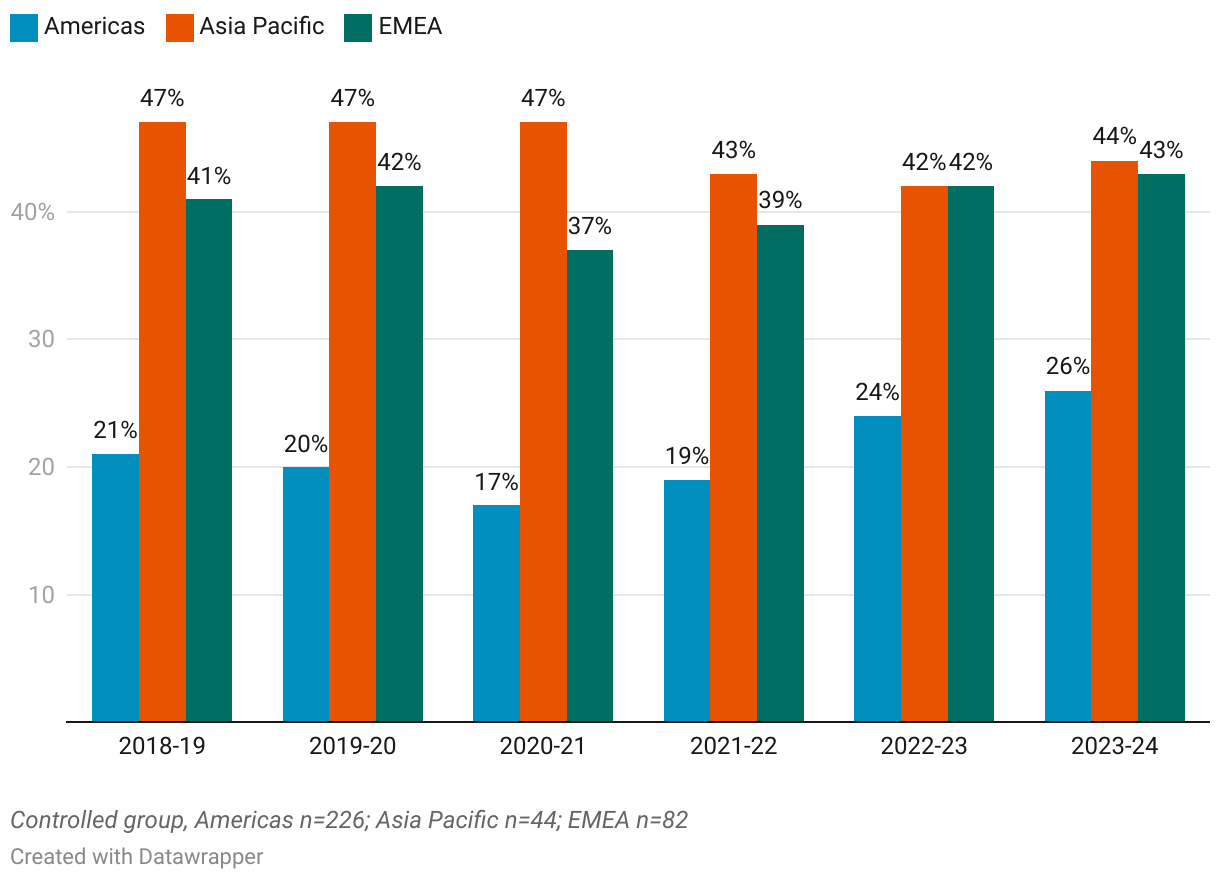
Regional trends highlight significant variations in international student representation.
In the Americas, international student presence dropped to 17 percent in 2020–21, likely due to pandemic-related challenges. However, by 2023–24, enrollment has rebounded to 26 percent, though it remains the lowest among all regions.
In the EMEA region, the proportion of international students has consistently remained around 40 percent over the past six years, reflecting a steady and stable international intake.
The Asia Pacific region stands out for having the highest proportion of international students in its master’s programs. This trend is largely driven by 11 schools in Oceania, where international representation has consistently ranged between 71 and 77 percent over the past six years. At the same time, schools in Asia have experienced steady growth in international student enrollment, rising from 18 percent in 2018–19 to 26 percent in 2023–24, further contributing to the region’s strong global appeal.
6-Year Trend in Distribution of International Students by Program
When looking at international student enrollment by program, the majority of these students—around 70 percent—are represented in master’s specialist programs, a segment that has experienced steady growth over the past six years. MBA programs, on the other hand, account for about 20 percent of international students, and this figure has remained consistent throughout the same period.
The majority of international students—around 70 percent—are represented in master’s specialist programs.
This distribution highlights the ongoing appeal of specialized programs for international students, while MBA programs maintain a stable, but smaller, share of the global student population.
Race and Ethnicity Trends in the United States
6-Year Trend in Percentage Breakdown of Race/Ethnicity in U.S. Master’s Enrollment
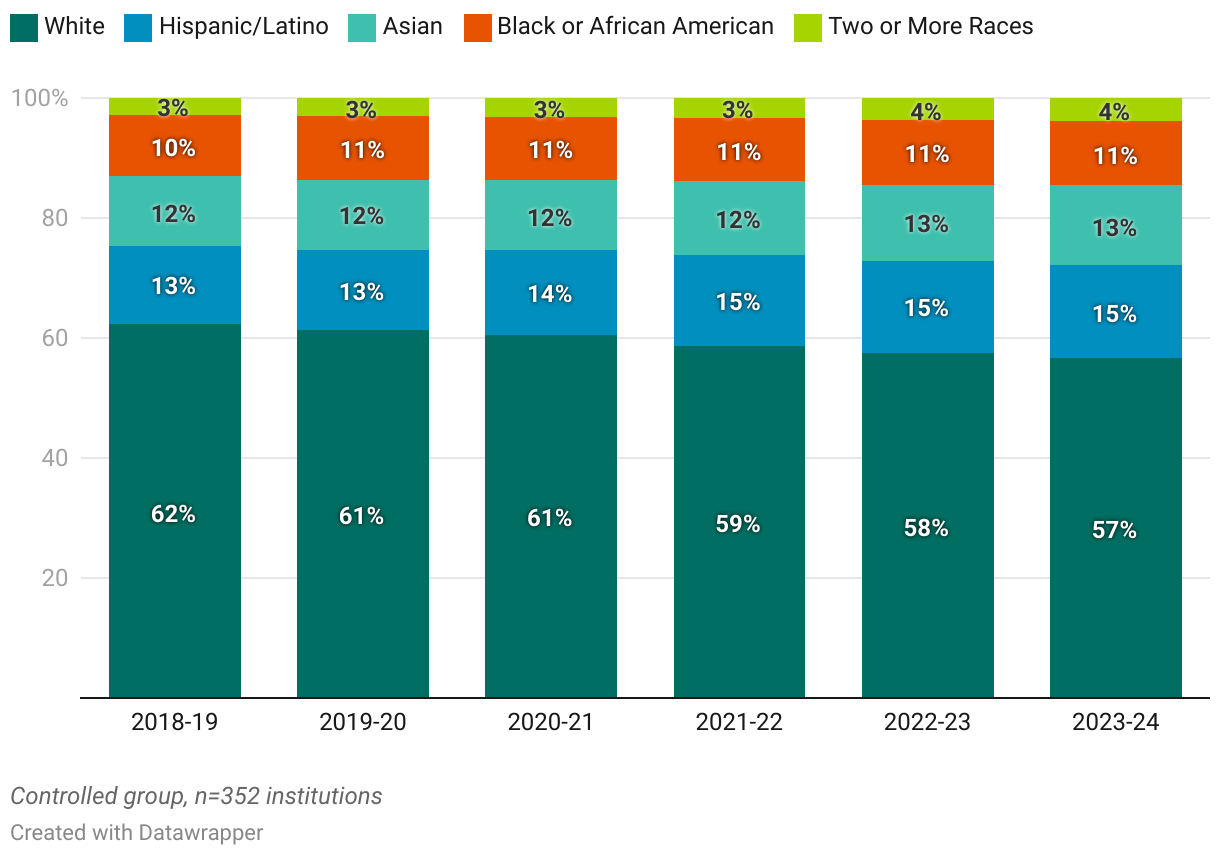
Racial and ethnic representation in U.S. master’s programs has seen gradual changes over the past six years. While white students still represent the majority, their numbers have steadily declined, dropping from 62 percent in 2018–19 to 56 percent in 2023–24. This shift isn’t attributed to any one group but rather to small yet consistent increases in enrollment among students who identify as Asian, Hispanic/Latino, Black or African American, and those of two or more races. These trends reflect a slow but noticeable diversification of the student body at the master’s level.
6-Year Trend in Race/Ethnicity Counts in U.S. Master’s Enrollment

While the overall proportion of non-White students hasn’t shifted dramatically over the past six years, the growth in actual enrollment numbers reveals some interesting nuances. Hispanic/Latino enrollment surged by 28 percent, Asian enrollment increased by 24 percent, and Black enrollment rose by 12 percent during this period. However, a notable trend is a rise in non-white student enrollment from 2019–20 to 2021–22, followed by a steady decline in the years following.
Compared to postbaccalaureate data from the National Center for Education Statistics (whose most recent published data is for 2021–22), business schools are closely tracking with national graduate enrollment trends. Some nominal differences emerge when comparing AACSB data and national data for the 2021–22 time frame.
Based on our sample, AACSB-accredited schools show a higher representation of Asian students (12 percent compared to the national 9 percent) and Hispanic/Latino students (15 percent versus 13 percent nationally). Conversely, Black or African American students are less represented at AACSB-accredited schools, comprising 11 percent of master’s level enrollment compared to 14 percent nationally.
Understanding the extent to which enrollment trends at AACSB-accredited schools align with broader national patterns can help us identify areas where greater diversity can be achieved and highlight opportunities for schools to enhance their appeal to underrepresented groups.
Changing Nature of Program Delivery and Formats
As new technologies reshape the landscape of education delivery, schools are increasingly adopting innovative digital solutions to engage with students. In response, AACSB has been continuously evolving its data collection on delivery methods to stay aligned with these industry changes.
Since 2020–21, AACSB has adapted its approach to reflect emerging trends in education delivery. Tracking these shifts in the coming years will provide valuable insights into how schools’ delivery preferences continue to evolve.
AACSB Definitions for Delivery Types
Below are the delivery method definitions from AACSB’s Business School Questionnaire, which schools can optionally use to report their enrollment figures.
|
MBA vs. Master’s Specialist Enrollment by Delivery Type
Although only a limited number of schools (168) consistently reported enrollment by delivery type over the past six years, the data reveal notable differences between MBA and master’s specialist programs—two of the most common master’s programs that offer diverse delivery options.
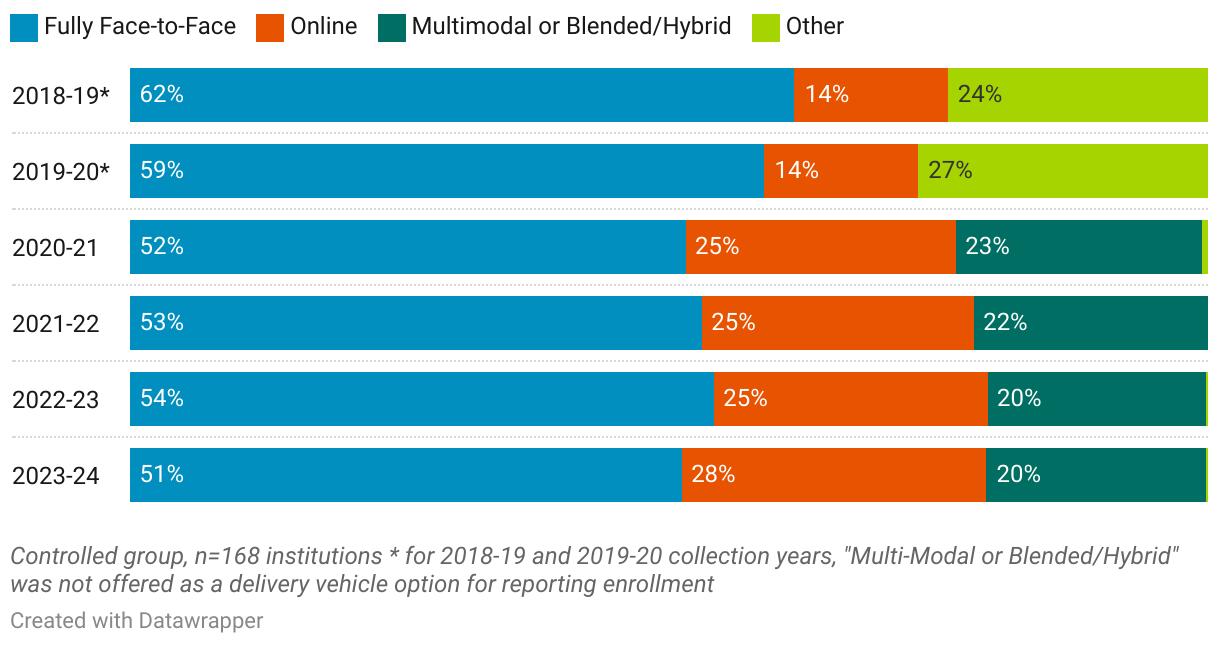
6-Year Trend of Enrollment by Delivery Type: MBA
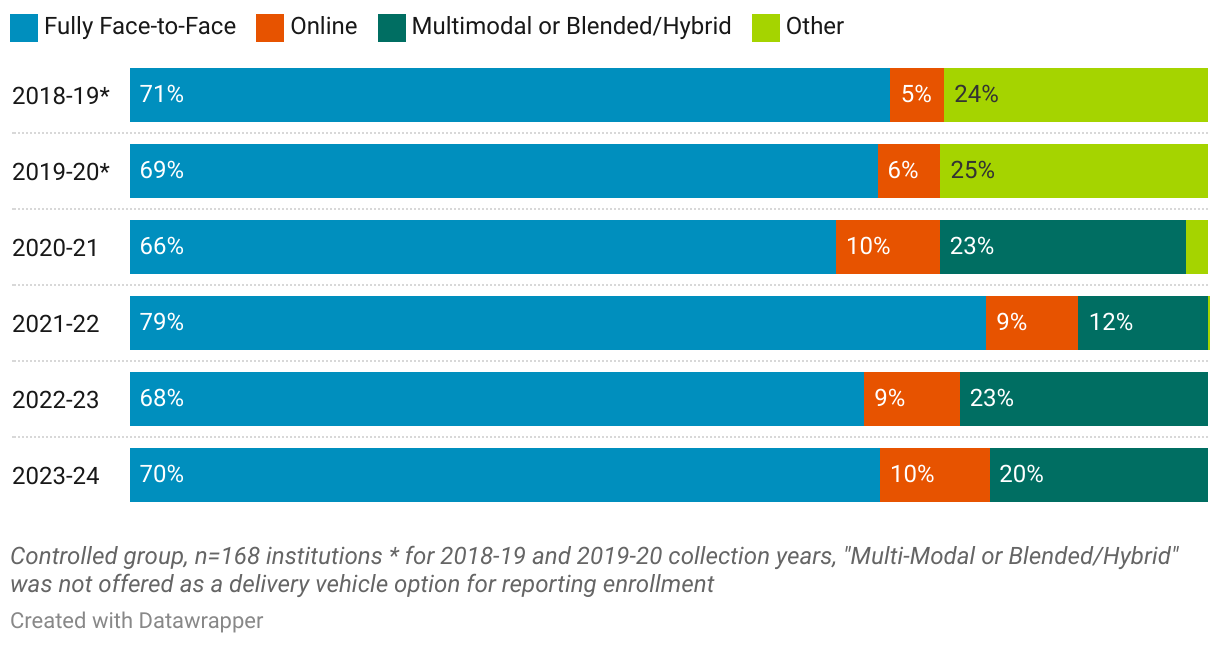
6-Year Trend of Enrollment by Delivery Type: Master’s Specialist
While the majority of students in MBA and master’s specialist programs are attending in person, enrollment patterns for MBA programs are shifting. Online and hybrid/multimodal options are now becoming just as popular as traditional face-to-face formats, signaling a growing preference for flexible learning.
In contrast, master’s specialist programs have remained more stable, with 70 percent of students still opting for face-to-face learning. However, there is a noticeable rise in interest in multimodal and hybrid formats, indicating that students are gradually embracing more flexible delivery options in these specialized programs as well.
Full-Time vs. Part-Time Enrollment
As the demands of students and professionals evolve, business schools are increasingly exploring flexible learning options, offering both full-time and part-time formats to meet diverse needs. Many students, particularly working professionals, may seek part-time programs that allow them to balance career responsibilities with academic growth. Meanwhile, full-time programs continue to appeal to those seeking a more immersive learning experience or a format that aligns better with the program’s specific focus.
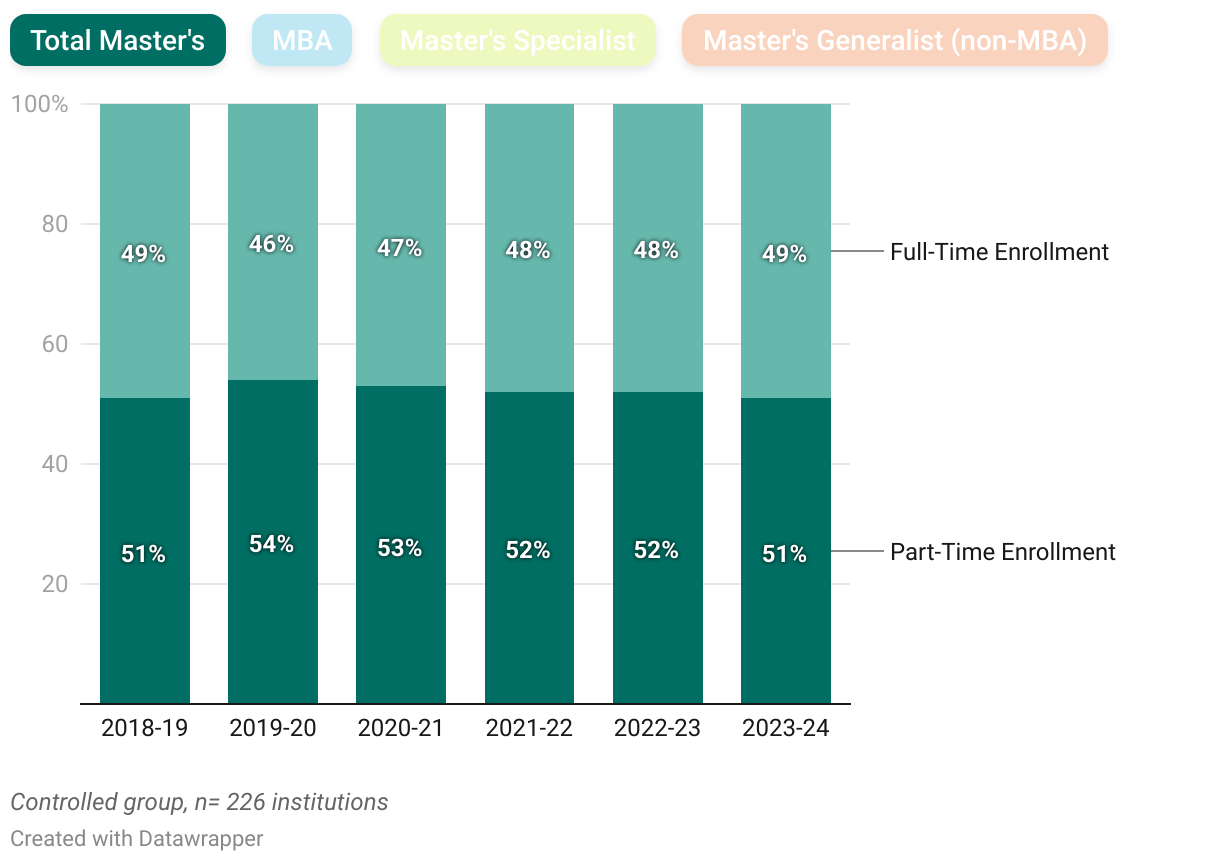
6-Year Global Trend of Master’s Full-Time vs. Part-Time Enrollment by Program

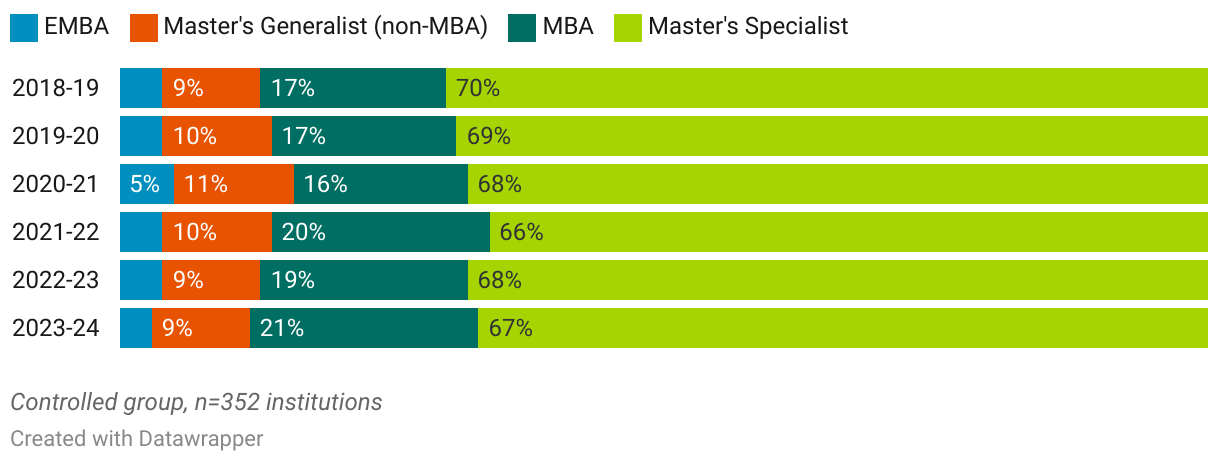
Over the past six years, full-time enrollment has consistently dominated graduate programs, including MBA, master’s generalist, and master’s specialist programs, accounting for 66–67 percent of total enrollment.
Among these program types, master’s specialist programs, which make up over half of all master’s enrollment, have been the primary driver of this trend, with about 80 percent of students pursuing full-time studies.
Although master’s generalist programs see an even higher percentage of full-time students, at 90 percent, they represent a much smaller share of overall enrollment in master’s programs—only 13 percent in 2023–24.
MBA programs, on the other hand, rely more heavily on part-time students, as many choose part-time study to balance education with their professional commitments. This contrast reflects the differing goals of these students: MBA students often seek flexibility to continue advancing their careers, while specialized master’s students typically pursue full-time study to fast-track their entry into the workforce.
These differences underscore the distinct roles each program can play in shaping career paths.
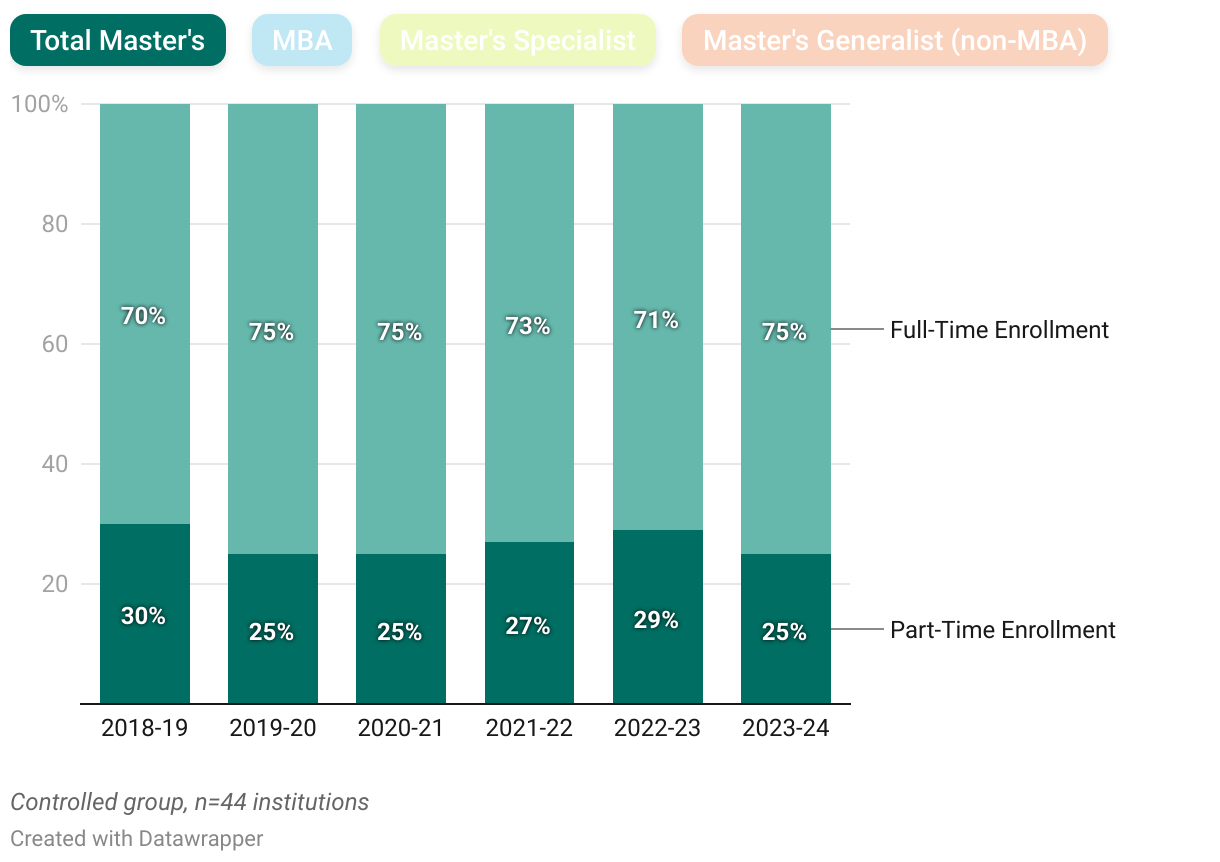
6-Year Trend of Full-Time vs. Part-Time Enrollment by Program: Americas
6-Year Trend of Full-Time vs. Part-Time Enrollment by Program: Asia Pacific
6-Year Trend of Full-Time vs. Part-Time Enrollment by Program: EMEA
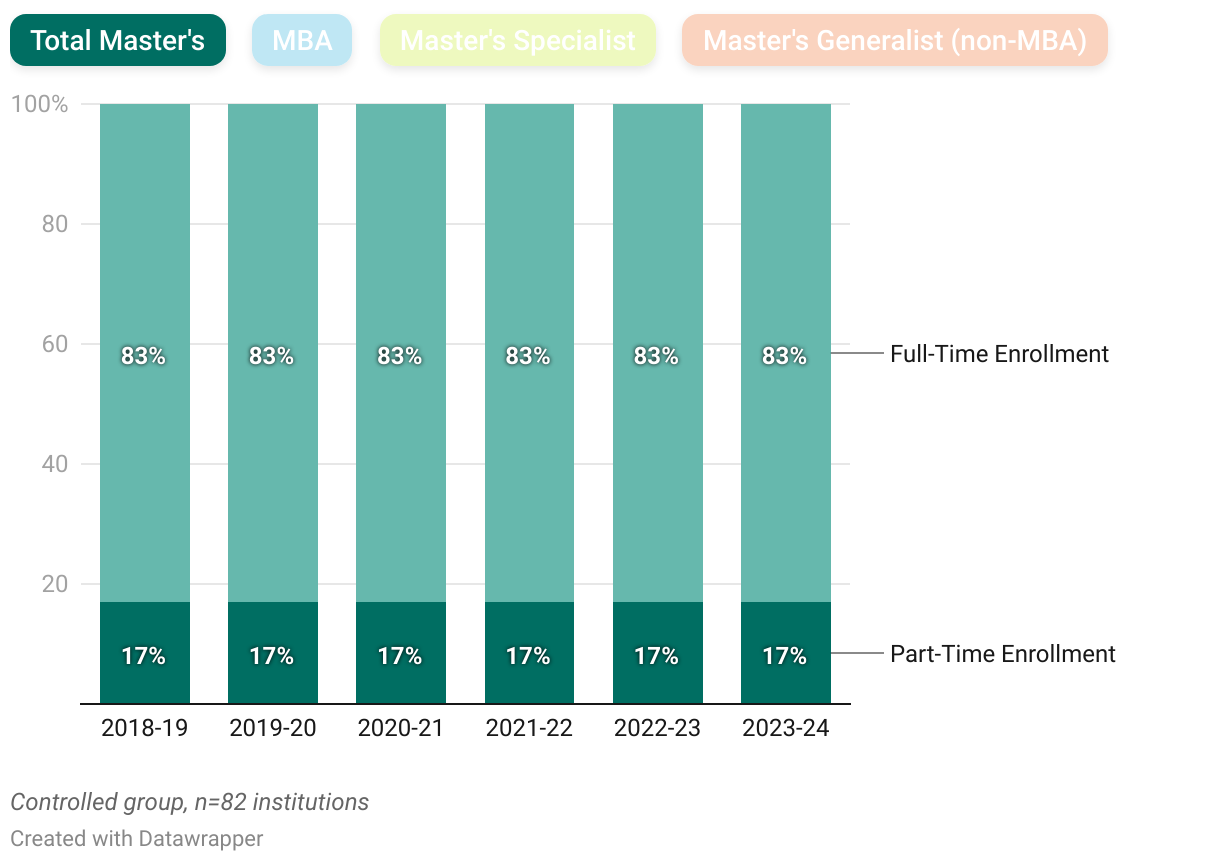
Regional Observations
The preference for full-time enrollment is particularly evident in EMEA schools, where 83 percent of total graduate students are enrolled full-time. This is especially true for master’s specialist programs, where nearly 90 percent of students in EMEA study full-time. By comparison, schools in the Americas present a more balanced ratio between full-time and part-time total enrollment, and with 62 to 65 percent of master’s specialist students opting for full-time study.
MBA programs exhibit a higher proportion of part-time enrollment, particularly in the Americas. In contrast, the EMEA and Asia Pacific regions favor full-time enrollment in MBA programs, though EMEA has seen a significant shift toward part-time enrollment since 2021–22, possibly indicating evolving professional demands.
Navigating an Evolving Environment
AACSB looks forward to analyzing its members’ master’s program admissions and enrollment data once the collection period concludes later this year, eager to identify any new trends or patterns that emerge in the 2024–25 academic year. While we await the full data, several schools have already shared interesting insights from around the world.
For example, Duke University’s Fuqua School of Business recently celebrated achieving gender parity in its Daytime MBA program, alongside a 15 percent increase in applications compared to last year. Dean Shari Hubert highlighted additional factors contributing to these shifts, including recent tech industry layoffs, which may have driven a rise in domestic applicants as professionals seek opportunities to upskill.
In recent roundtable discussions facilitated by AACSB, business school deans have shared a range of experiences regarding their master’s programs. Although the data in this report do not suggest significant declines in international student enrollment, many schools still consider attracting international students a major challenge. However, schools in certain regions, like Sasin School of Management in Thailand, are more optimistic. They anticipate increased interest from international students, driven by Southeast Asia’s growing influence in the global economy and a young population eager to upskill and meet the demands of the evolving job market.
Many schools also noted that specialized master’s programs are performing particularly well compared to MBAs, driven by increasing demand for specialized skills in areas like technology, analytics, sustainability, and niche industries. Schools are responding by creating new offerings tailored to these trends.
Mariëlle Heijltjes, dean of Maastricht University’s School of Business and Economics, spoke about the regional differences impacting enrollment, acknowledging that while challenges vary from continent to continent, they are interconnected. She also stressed the often-overlooked role of faculty in navigating enrollment challenges.
Whether schools are targeting new international student markets, responding to industry demands with specialized programs, or focusing on lifelong learning as part of their strategies for circumventing enrollment challenges, faculty need to be equipped with the right mindset and competencies to effectively deliver quality education in these evolving spaces.
Shaping Future Directions
AACSB’s data on graduate enrollment at accredited business schools reveal important trends, both stable and changing, across programs and regions. While overall enrollment is resilient, evolving preferences for specialized programs, regional and demographic shifts, and the balance between full-time and part-time formats reflect the dynamic nature of the business education landscape.
These insights help institutions not only benchmark their performance but also inform strategic decisions about program offerings, resource allocation, and future growth. As business education continues to adapt to global challenges and market demands, AACSB is committed to sharing data-driven insights, learning and development opportunities, and thought leadership content that help schools align their academic offerings with the needs of students, employers, and society.