


New Insights on Global Business School Finances and Operations
AACSB has released the annual Overview Reports and benchmarking data for the 2018–19 Business School Questionnaire (BSQ) Finances Module. While many data points carry over from the main AACSB BSQ data collection, such as budget, tuition, and endowments, the BSQ Finances Module offers even more comprehensive insight into the financial activity, resources, and governance of business schools in AACSB’s global member network.
In addition, the BSQ Finances Module provides information on the activity of business school advisory councils, resource allocation factors, tuition collection models, and how various business school functions or operations are managed or controlled (such as school-specific libraries, career services, admissions, academic advising, and more). To learn more about the types of data collected in the BSQ Finances Module, please see the AACSB Data Glossary.
Net Flow of Funds Between Business School and Parent Institution
One of the unique data points collected in the BSQ Finances Module is the business school’s net flow of funds to and from its parent university/institution. AACSB is the only organization that collects and provides this information at the institutional level to all schools that participate in the survey. Net flow is defined as the total of all business school funds spent, subtracted from the total revenue generated by the business school.

Figure 1: Net Flow Formula Used for BSQ Finances Module Governance Section
A positive net flow suggests that the business school provides a net positive cash flow to the parent institution, a negative net flow suggests that the parent institution provides a net positive cash flow to the business school, and a zero net flow suggests that all transfers of funds for the year between the school and the parent institution balance out. To calculate this value, three values (the school’s total use of operating funds, any additional funds added to direct control of the school, and the total unused funds) are summed and then subtracted from the total revenue generated by the school.
(Click below image for interactive data displays.)
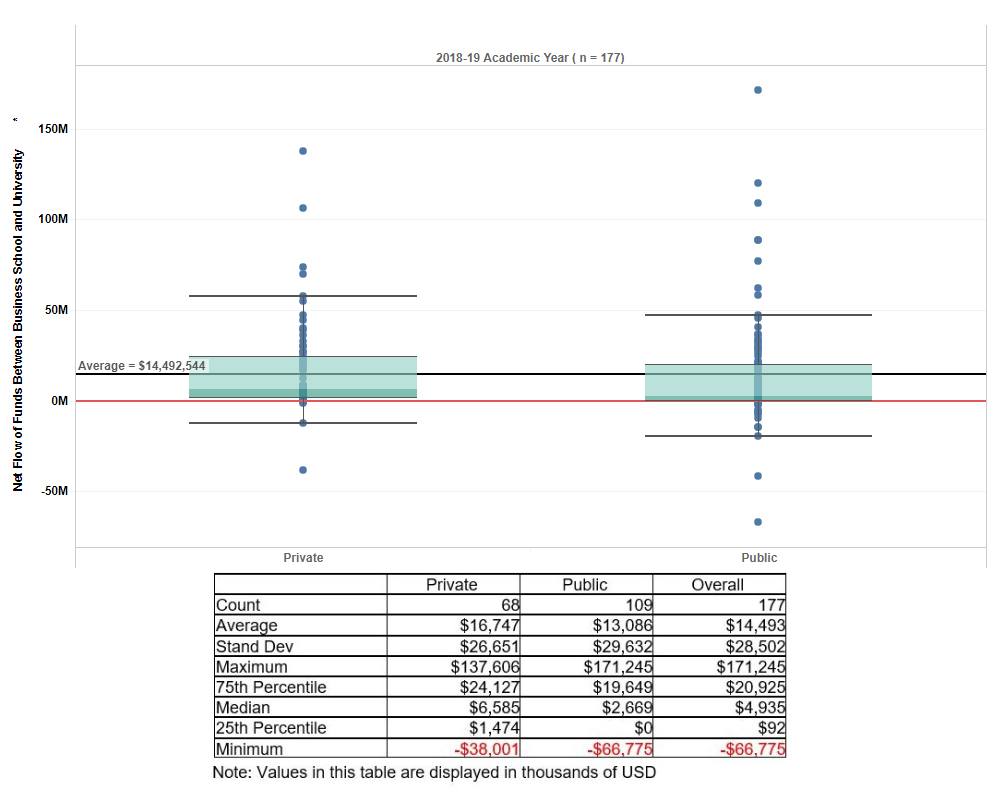
Figure 2: Net Flow of Funds in Academic Year 2018–19 for 177 AACSB Member Schools
Net Flow of Funds in the 2018–19 Academic Year* Regarding Private and Public Schools
A total of 177 business schools** submitted data on their net flow of funds. The average net flow reported was approximately 14.5 million USD. Nine percent of the responding schools (n=16 schools, including five private and 11 public) reported zero net flow (i.e., balanced transfer of funds between the school and the parent institution).
As seen in the graph and table provided (see tab labeled 2018–19 AY Net Flow of 177 AACSB Members), while the average net flow for private schools was higher than that for public schools, there was a negligible difference in their distributions. About 15 percent of the schools indicated they had a negative net flow (n=26 schools, including five private schools and 21 public). Overall, the median net flow for private schools was more than twice as much as the median next flow for public schools.
Five-Year Trend in Net Flow of Funds
A set of 56 schools has consistently reported their net flow for the last five academic years (2014–15 through 2018–19), providing an ability to track shifts over time (48 of which are U.S. schools, three are Canadian, and one school each is from Egypt, Lebanon, New Zealand, and the U.K.). A few schools have noticeable variation across the years, but the overall net flow across time has had very little change for these schools.
The average net flow for the 2018–19 academic year was higher than the average for the 2014–15 academic year for these 56 schools (approximately 16 million USD and 11 million USD, respectively) and there was slightly more variability for the 2018–19 academic year. The difference between the two interquartile (IQR) ranges for these two academic years (75th percentile to 25th percentile, i.e., the middle 50 percent) was about 5 million USD. It is important to note, however, that while the difference in the inter-quartile range has increased only slightly over time, there is much more variability in the most recent set of the data for this group of schools, where less than 25 percent indicated that their net flow was zero or less.
The table and graph found in the tab labeled Net Flow Five Year Trends for 56 AACSB Members 2014–15 AY – 2018–19 SY by Type of Control displays the information regarding these 56 schools based on whether they are a private (n=25) or a public (n=31) school. Over the last five years the 25 private schools’ distributions have remained stable, where more than 75 percent of the schools had a positive net flow. The IQR across all five years also remained stable (approximately 30 million USD) where there was a slight increase in the 2016–17 and 2017–18 academic years. However, there was noticeable increase in the standard deviation (an increase of approximately 8 million USD).
In contrast, the difference across years for the distribution of net flow for the 31 public schools had an IQR for 2018–19 that was more than two times as much as in the 2014–15 academic year (approximately 21 million USD and 9 million USD, respectively). In addition, the average was almost twice as much in 2018–19 (approximately 12 million USD and 6 million USD, respectively), and the standard deviation was also substantially higher (about 9 million USD). Over the years it seems that, while most public schools have been able to maintain a positive or zero net flow, a few schools had much more variability in the actual values for these schools where the net flow, while positive, changed considerably.
Information for each individual school’s net flow (anonymized) is displayed in the last two tabs, with further details available via the DataDirect benchmarking tool for schools that participated in this year’s 2018–19 BSQ Finances Module. Not only do participating schools have access to this year’s data, but they can also access all historical data regardless of whether the school participated in previous years’ surveys.
In addition to these data, more information on budgets, funding, governance, and faculty compensation is now available in the 2018–19 BSQ Finances Module Overview Reports, or by using the benchmarking tools in DataDirect. Access to these reports and the benchmarking tools is a part of the membership benefits for all schools that submitted a validated BSQ Finances Module.
Business schools that participated in this year’s BSQ Finances Module have access to the full suite of reporting tools to create their own custom reports, using groups defined by geographic region, accreditation status, and/or other institutional characteristics. For further information about this and other surveys, please visit the DataDirect area of our website. If you have questions about these reports, the BSQ Finances Module, or other AACSB Business Education Intelligence products, please contact us at [email protected].
*The academic year as defined here as beginning September 1 through August 31 of the following year.
**Includes schools that self-classify as either standard academic unit of a parent institution or semi-mostly autonomous unit of a parent. Independent, standalone institutions do not report a net flow.