New Data Available on Today's Global Business Schools
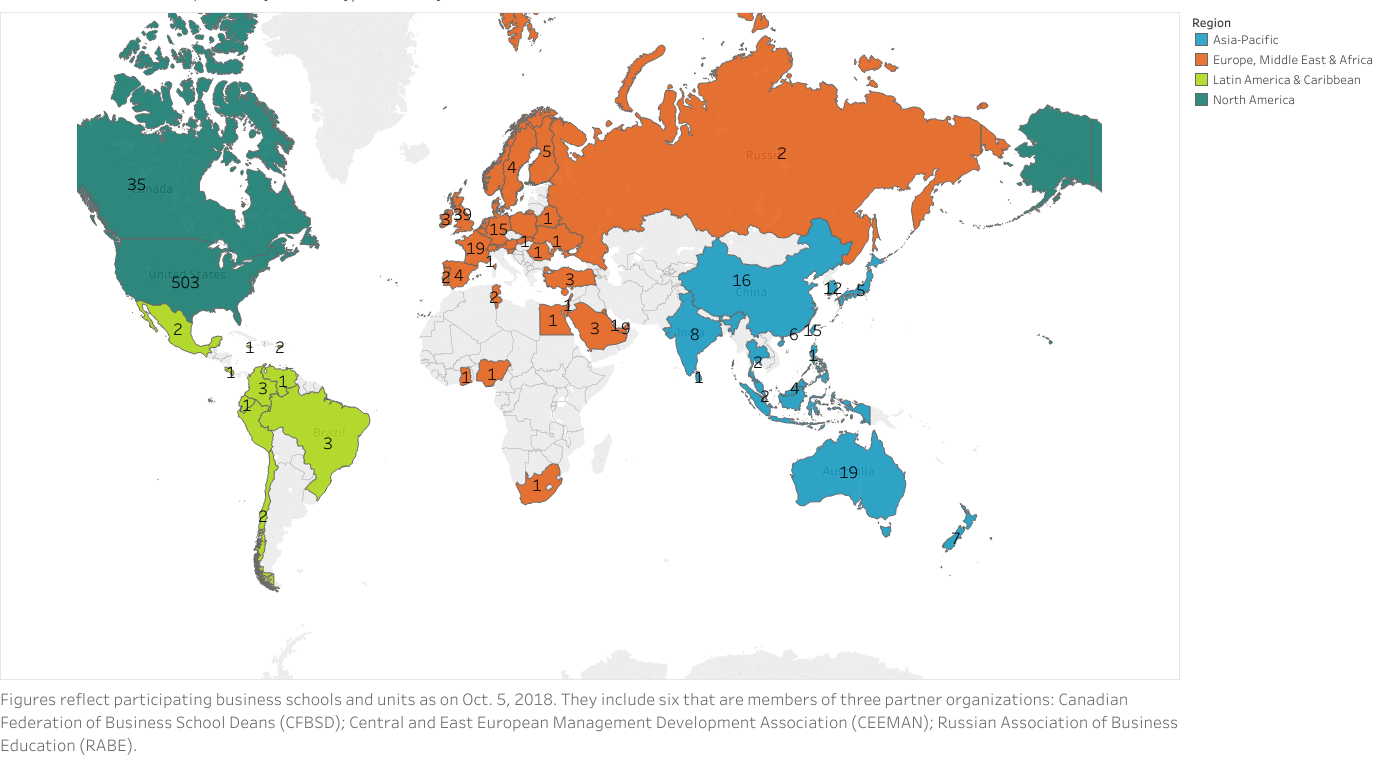
We are excited to announce that the full data set for the 2018–19 Business School Questionnaire (BSQ) has been released to all participating member schools, with over 800 participants representing 61 countries and territories worldwide.
Figure 1. AACSB 2018-19 BSQ Participation Map
Note: Figure reflects participation of business schools as of October 1, 2019.
With approximately half of AACSB member institutions participating, this year’s data provides valuable insight into current trends in business education, especially among AACSB-accredited institutions, which are heavily represented in the data set. Available data includes institutional characteristics, mission, enrollment, admissions, degrees conferred, programs offered, faculty and staff demographics, finances, and more. The following data points represent just a small sample of the types of data available in the DataDirect system. For a more comprehensive list and descriptions of the types of data available, please see the AACSB Data Glossary.
What Do Schools Emphasize?
All schools that participate in the BSQ share their mission, the year the mission was adopted or revised, and the year their strategic plan was adopted or revised. While the full text of each mission statement is available, schools also respond to unique questions only found in the BSQ, where they indicate the extent to which they emphasize teaching, intellectual contribution, and service activities.
For this year’s BSQ, 93 percent of the schools that submitted a BSQ indicated that they place a high emphasis on teaching in their business school priorities, while about 61 percent indicated that they highly emphasize intellectual contribution, and 18 percent place a high emphasis on service. Figure 2 displays the results for this year’s BSQ.
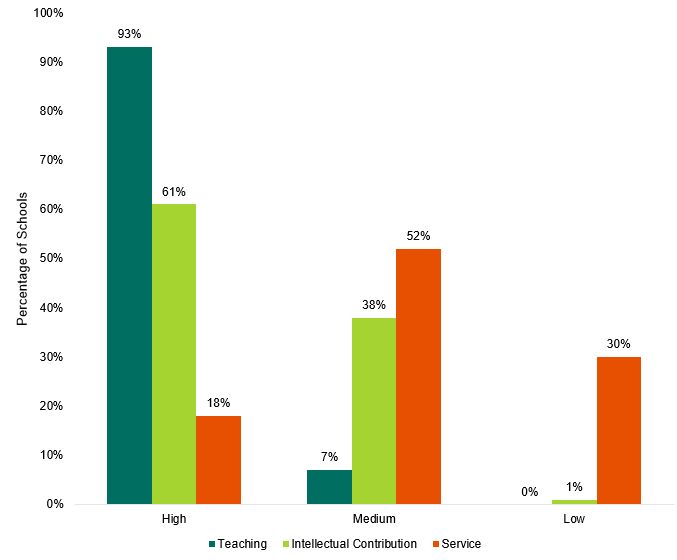
Figure 2. Business Unit Activity Priorities—Emphasis
Another piece of information schools share is the extent to which they prioritize research in the areas of teaching and learning scholarship, applied or integration/application scholarship, and basic or discovery scholarship, as defined in the current AACSB business accreditation standards. The results of this year’s BSQ reveal that 57 percent of participating schools place a high emphasis on basic or discovery scholarship, whereas 52 percent highly emphasize integration/application scholarship. About 33 percent of all schools reported teaching and learning scholarship as an area of high emphasis. Figure 3 displays the results for this year’s BSQ.
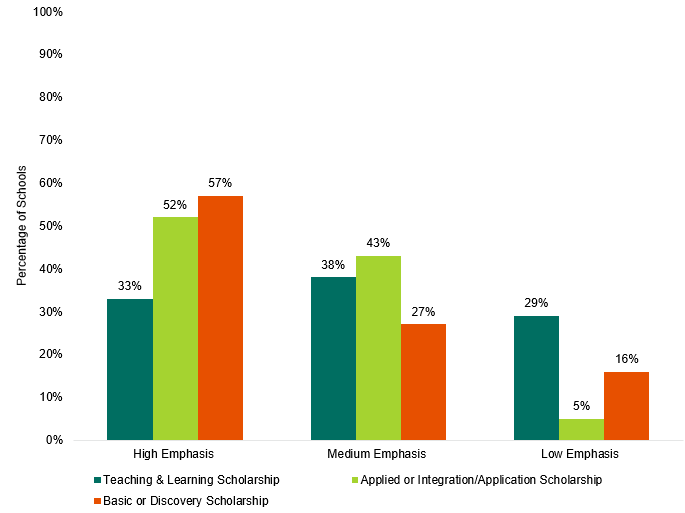
Figure 3. Business Unit Research Priorities—Emphasis
How Long Have Business Degree Programs Been Offered?
This year, for the first time, we asked each school to indicate the year each reported program first began accepting applications. A slight majority of programs (approximately 54 percent) were started within the last 20 years (after 1999). About 95 percent of schools reported that they had at least one program that was less than 20 years old, and 88 percent of the schools indicated that they had a least one program that started before 1999, such that around 46 percent of the programs started before 1999.
Table 1. Percentage of Degree Programs Started Before and After 1999 by Program Level| Program Level | Pre-1999 | 1999-2009 |
After 2009 |
| Undergraduate | 54.3% | 19.2% | 26.6% |
| Integrated Undergrad-Master's |
49.5% | 17.9% | 32.6% |
| Master's Generalist (EMBA) | 43.0% | 31.6% | 25.4% |
| Master's Generalist (MBA) | 55.6% | 16.4% | 28.0% |
| Master's Generalist (MBA/Dual Degree) | 48.0% | 26.8% | 25.2% |
| Master's Generalist (non-MBA) | 29.4% | 28.3% | 42.2% |
| Master's Specialist |
25.2% | 29.2% | 45.6% |
| Doctoral | 56.4% | 21.8% | 21.8% |
| Grand Total |
46.2% | 22.2% | 31.7% |
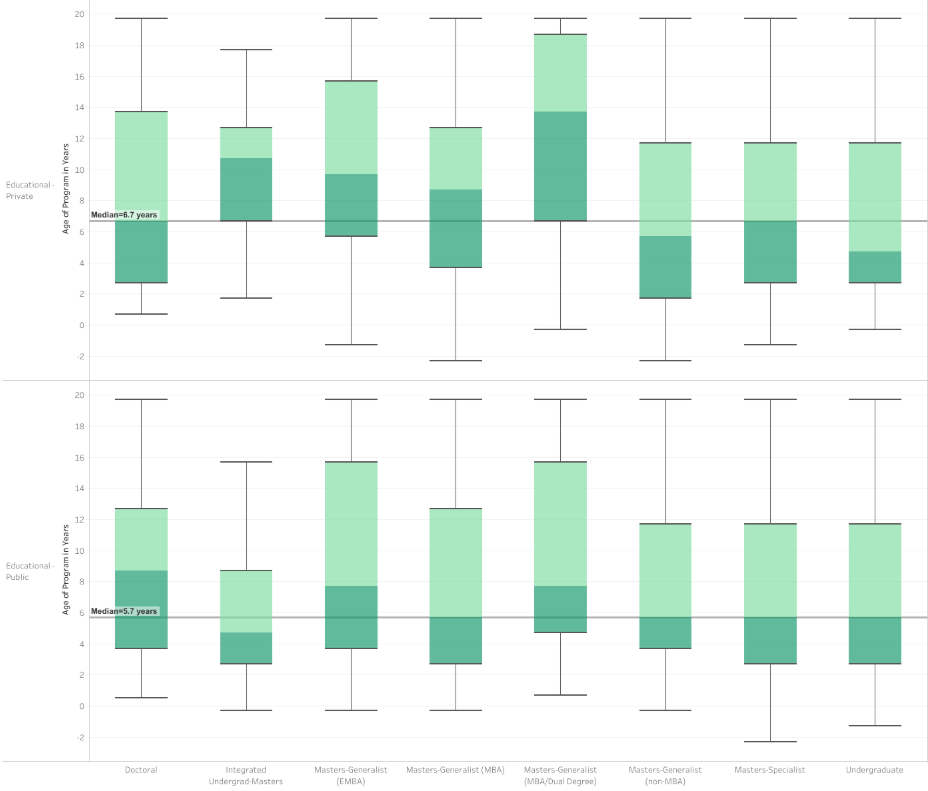
The median age of programs that started after 1999 for private schools was 6.7 years, and the median age for public schools was 5.7 years. These figures reflect the number of new programs that have been added and do not necessarily reflect any changes to required courses within a program, the curriculum of those courses, or the modality by which a program is delivered. The distribution of program ages is displayed in Figure 4 by type of school control (private vs. public), and program level.
Figure 4. Distribution of Age of Programs Added After 1999 by Type of School and Program Level
Note: While not required, 15 schools chose to report a least one program that is scheduled to begin accepting applications between 2019 and 2021. It is possible that many more AACSB-accredited schools are planning to add new programs in the next two to three years.
Where Do Schools Focus Their Student Recruitment?
In addition, this year’s BSQ included new categories for the geographic scope of student recruitment. These responses are collected by program and focus on whether students are being recruited more within or beyond the national borders of its location. The majority of the 806 participating schools focus their student recruitment primarily within their national borders, but a substantial number of schools (30 percent) recruit their undergraduates near their location (locally or within the state or providence). However, global recruiting (throughout the entire world) is the focus for 31 percent of EMBA programs, 39 percent of MBA programs, 44 percent of other master’s programs, and 63 percent of doctoral programs. Non-MBA master’s programs (other master’s) and doctoral programs were the only levels at which the majority of schools focus their recruiting outside their national borders (either globally or within the continental region). Figure 5 displays the focus of student recruitment for each type of program level.
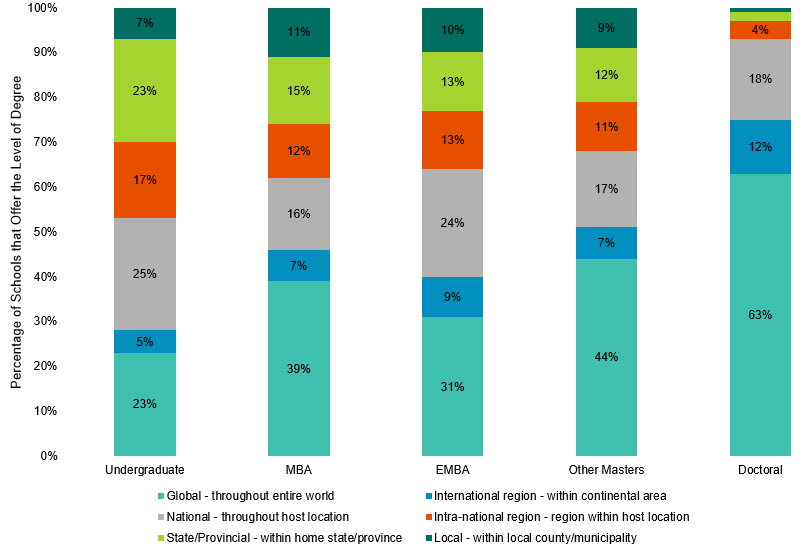
Figure 5. Focus of Student Recruitment by Program Level
Note: percentage is based on the total number of schools that reported based on the type of degrees offered; not all schools offer all degree levels.
The 2018–19 BSQ Executive Summary, now available for download, contains additional data from the survey, including an in-depth treatment of the section on institutional characteristics. All these data points and hundreds more are accessible in DataDirect for participating AACSB member schools, to provide them with context to inform strategic and tactical decision-making.
We would like to thank our member schools that generously give of their time to complete the survey each year. They play an important role in contributing to AACSB’s recognition as the primary source for data and analysis on business education globally.


