Faculty Salaries in Relation to AACSB Qualification Categories
Data from the 2018–19 Staff Compensation & Demographics Survey (SCDS), formerly known as the Salary Survey, are now available. Now in its 51st year, the SCDS is the longest-spanning and most globally comprehensive data source of business school staff salaries. For this year’s survey, 475 AACSB member schools, representing 27 countries and territories, participated. The results include information on almost 31,000 full-time business school faculty members across 35 business fields, along with data on approximately 4,200 administrators representing 22 positions normally found in business schools.
A unique feature of this survey, the SCDS leverages the faculty qualifications defined in AACSB’s 2013 business accreditation standards to categorize faculty. They are categorized as either being a Scholarly Academic (SA), Practice Academic (PA), Scholarly Practitioner (SP), Instructional Practitioner (IP), or Not Listed/Unknown (NL/UN). These are categories based on the faculty members’ initial academic preparation, initial professional experience, and sustained academic and professional engagement. A majority of the faculty reported (approximately 73 percent) are categorized as SA. This is also the case at each individual faculty rank, with the exception of the instructor rank, where only 18.5 percent are categorized as SA and a majority (approximately 54 percent) are categorized as IP (see Table 1).
| Faculty Qualifications | ||||||
|---|---|---|---|---|---|---|
| Rank | SA | PA | SP | IP | NL/UN | Number of Faculty |
| Professor | 87.8% | 6.2% | 1.5% | 1.0% | 3.5% | 8,426 |
| Associate Prof. | 84.0% | 6.8% | 2.0% | 1.8% | 5.4% | 8,104 |
| Assistant Prof. | 86.2% | 4.1% | 2.2% | 4.1% | 3.5% | 8,092 |
| Instructor | 18.5% | 12.3% | 9.6% | 53.8% | 5.9% | 6,177 |
| Number of Faculty | 22,322 | 2,158 | 1,062 | 3,884 | 1,373 | 30,799 |
| Percentage of Faculty | 72.5% | 7.0% | 3.4% | 12.6% | 4.5% | 100% |
Table 1: Percentage of Faculty by Rank and Qualification Faculty Qualifications
Participants reported a total of 30,200 full-time faculty salaries. The percentage distribution for rank and qualifications is generally the same for this smaller set of faculty.

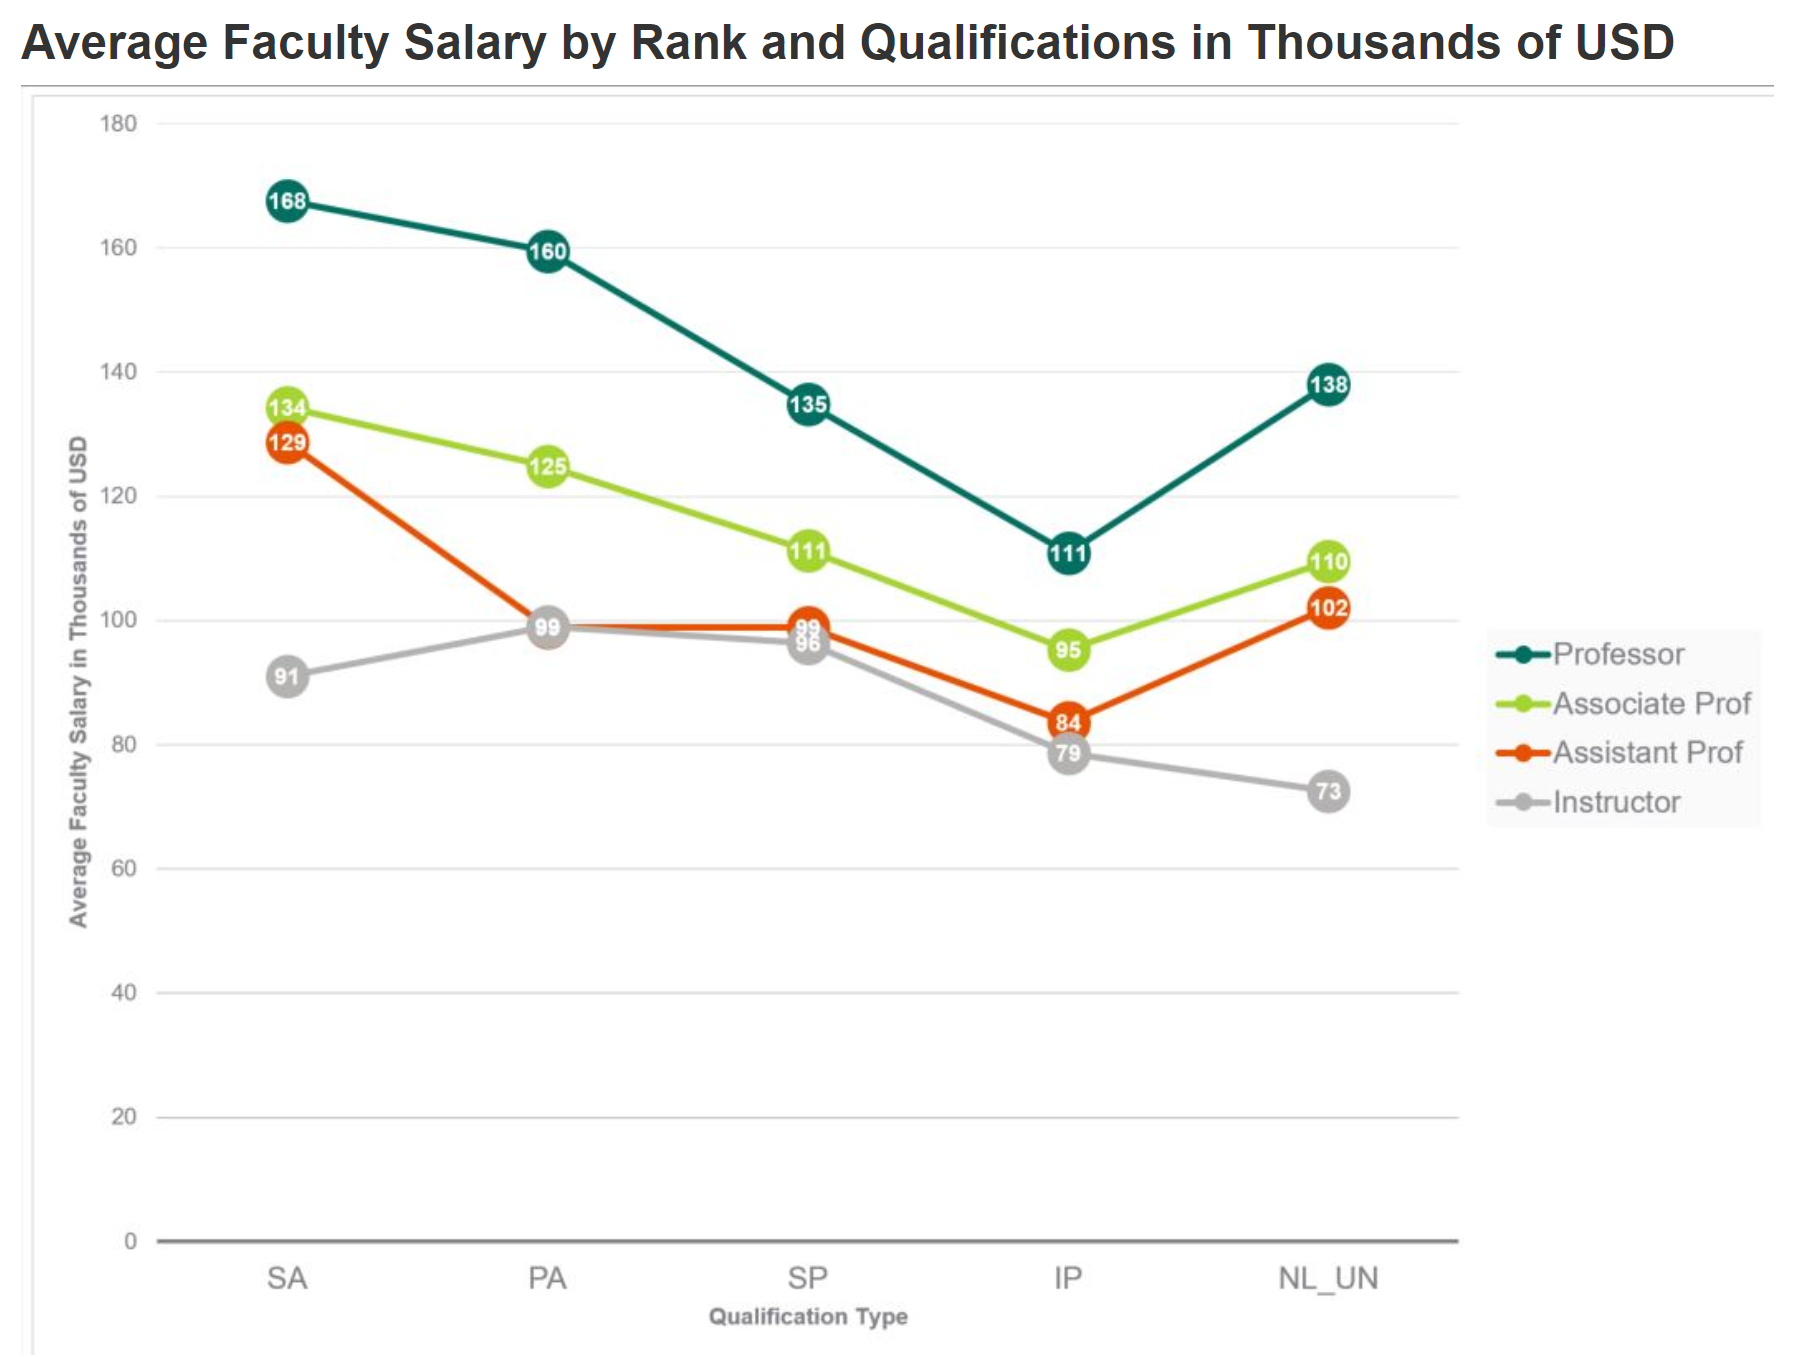
The average nine-month salary for these 30,200 faculty is approximately 129 thousand USD. When broken out by rank and qualification, the highest average salary for the professor, associate professor, and assistant professor ranks belong to the Scholarly Academics (SA) category (with an average of 168, 134, and 129 thousand USD, respectively). However, at the instructor rank, the highest average salary of 99 thousand USD belongs to the Practice Academic (PA) category, followed by Scholarly Practitioners (SP), at an average of 96 thousand USD.
Regarding the inter-quartile range that represents the salaries between the 25th and 75th percentile, there is quite a bit of overlap regarding salaries for each qualification within each rank. For example, for professors who were categorized as SA, the salaries range from 118.5 thousand USD (25th percentile) to 205.7 thousand USD (75th percentile). For professors who were categorized as PA the range is from 113.5 thousand (25th percentile) to 196 thousand USD (75th percentile). A similar pattern is seen across the other three faculty ranks.
While rank and discipline do make a difference when it comes to faculty salaries, there seem to be only subtle salary differences in relation to faculty qualifications. On average, faculty categorized SA do seem to earn more, but there is certainly an overlap in the range of salaries across these categories. When schools use faculty qualifications to benchmark trends in business school faculty salaries, we recommend that they take into consideration the various ways that schools define these categories and always consider the range as well as the average.
Schools that participated in this year’s SCDS survey have access to explore in greater depth salary comparisons on these dimensions and others, for their custom-defined peer groups, using the AACSB DataDirect benchmarking tool. As always, please contact the AACSB BEI team at [email protected] with any questions.


